Build a live motor dashboard with ThingsBoard AI in about 90 minutes: one prompt for an RPM gauge, a Node-RED simulation over secure MQTT, an AI-expanded overview and AI-created alarm rules.
Listen to this pageabout 13 min
Build a live motor dashboard with AI in about 90 minutes.Start with one RPM gauge, then expand it with AI. Your PC sends simulated motor data from Node-RED; no physical motor is needed.You will use prompts to create the device, dashboard and alarm rules, then approve the proposed changes. Node-RED supplies the data; AI designs the display. Start with the simple gauge so you can check the connection before adding more widgets.
Your local Node-RED simulation connected to ThingsBoard Cloud over MQTT.
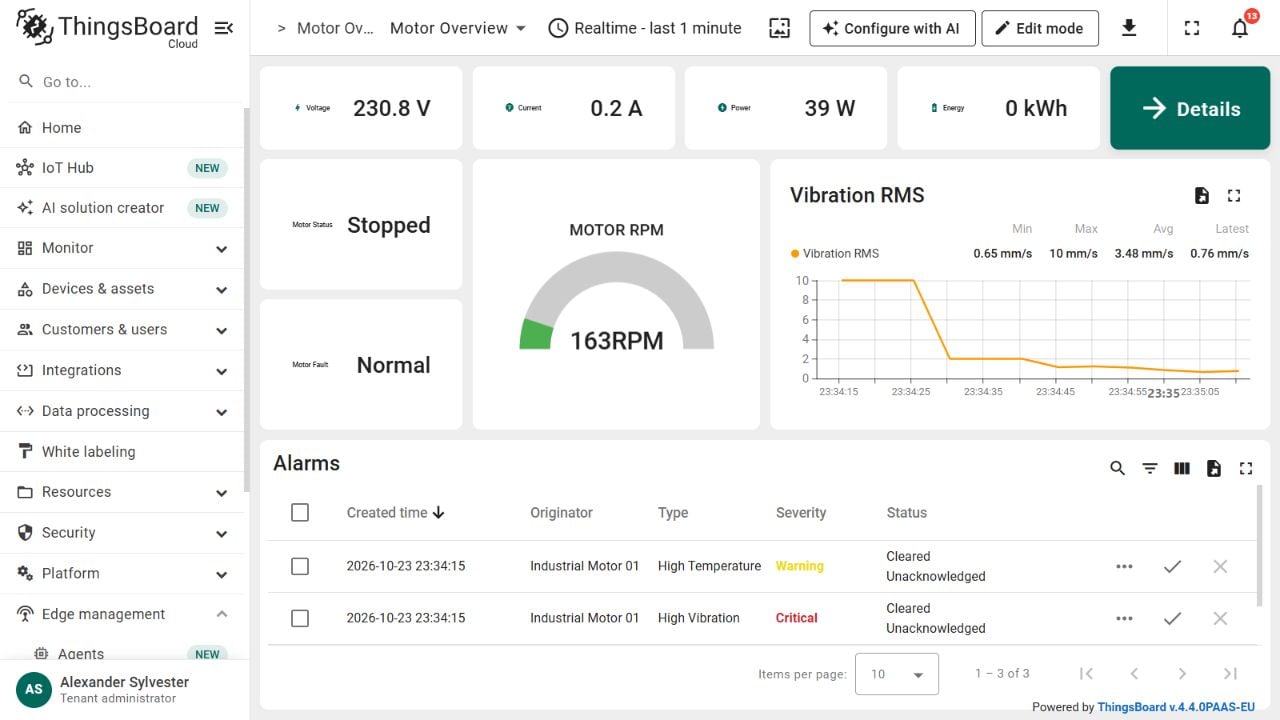
A compact motor dashboard built with the Configure with AI feature in ThingsBoard, including electrical readings and vibration trends.
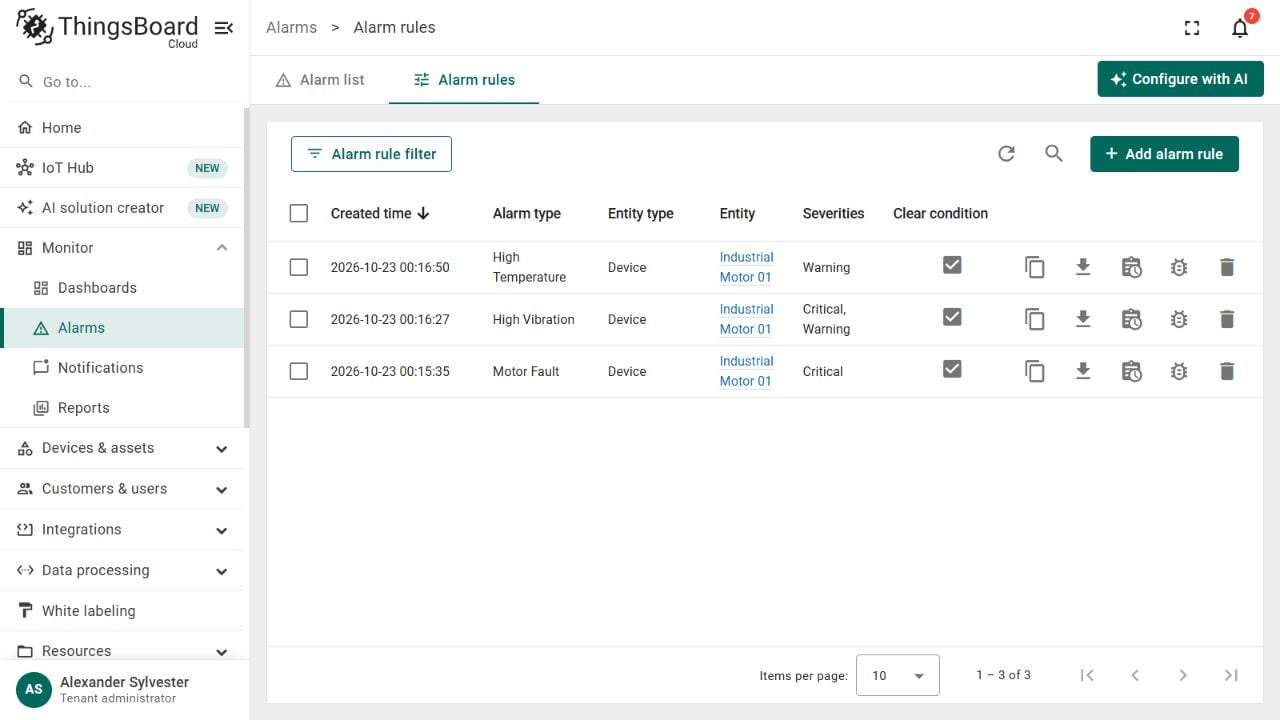
Alarm conditions for motor faults, high vibration and high temperature.
Allow about 90 minutes for registration, Node-RED motor simulation setup and checks, or about 60 minutes if your ThingsBoard account and Node-RED are ready. Optional manual styling comes last.
Edge demo: This guide reuses its MQTT example and motor simulation as an importable flow. Here, ThingsBoard Cloud EU and AI replace the local ThingsBoard setup. No PLC project or Python/HTTP example is needed.
Want to get started with ThingsBoard Cloud?Create an account or sign in here.
Development PC / laptop with an internet connection. No physical motor is needed.
Software
ThingsBoard Cloud EU with Tenant Administrator access. The EU Free plan includes 2.5 million monthly AI credits; Prototype includes 4 million. Free can complete this guide with sufficient remaining credits and device, telemetry, storage and alarm allowances. Check API usage before Step 2; repeated AI changes consume more credits.
Keep your Cloud account and Node-RED editor open in separate browser tabs. You will move between them to copy device credentials, publish data and check the dashboard.
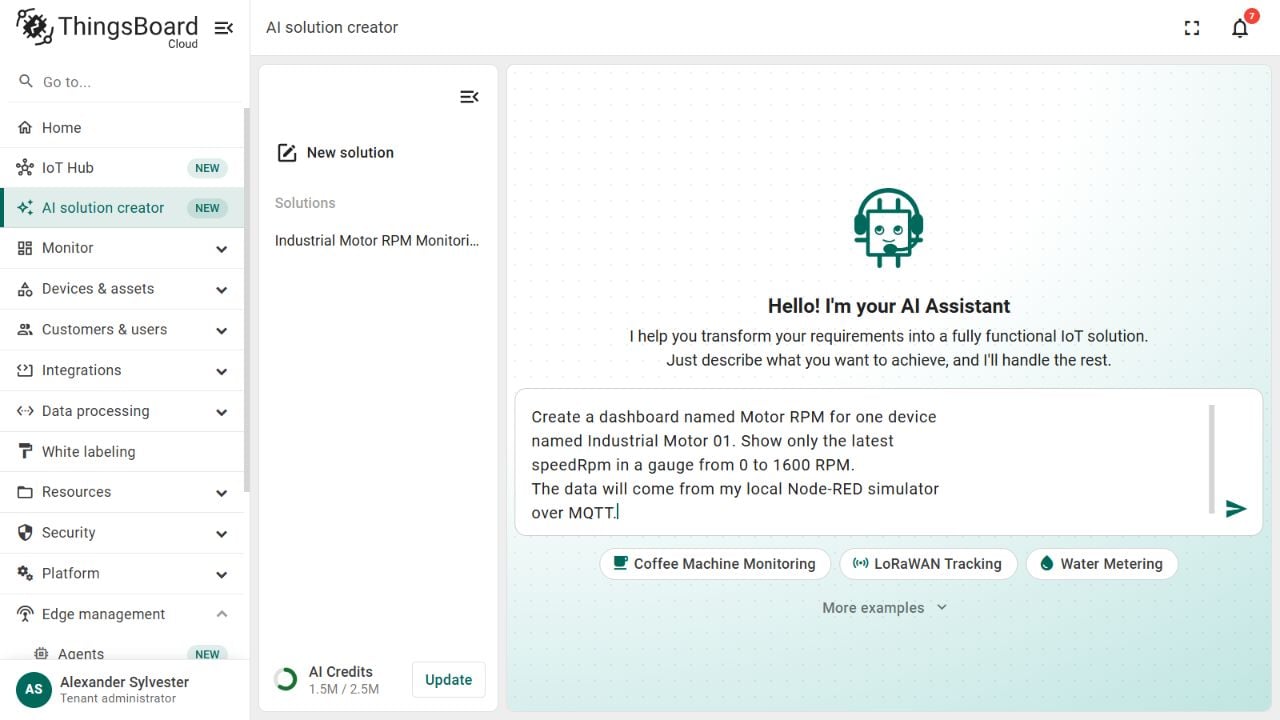
Open AI solution creator → New solution and enter:
Create a dashboard named Motor RPM for one devicenamed Industrial Motor 01. Show only the latestspeedRpm in a gauge from 0 to 1600 RPM.The data will come from my local Node-RED simulatorover MQTT.
The simple prompt in AI Solution Creator.
2
Review and create the solution
Select Skip interview if offered. Check the proposed device name, speedRpm key, and 0–1600 RPM gauge. The telemetry key is the name Node-RED sends; it must match exactly, including capital letters.Review the full proposal. Approve only one motor device and its RPM dashboard. Ask AI to remove unrequested users, roles, assets, devices, calculated fields, alarm rules or emulators before installing; alarms come in Step 5.Continue through Dashboard Design, then click Create Solution.Open Motor RPM. Connect Node-RED next to supply its data.
Already have a motor dashboard? Export a backup, then use Configure with AI on it instead of installing another solution.
The attached flow packages the Edge demo’s motor simulation with a secure MQTT connection. Install Node-RED first using the links under Before you start.
1
Import the project
Start Node-RED and open localhost:1880. Select Menu → Import, choose the attached JSON project, and click Import. Reuse the existing flow if it is already imported; running two copies would publish duplicate samples.
industrial-motor-cloud-flow.json
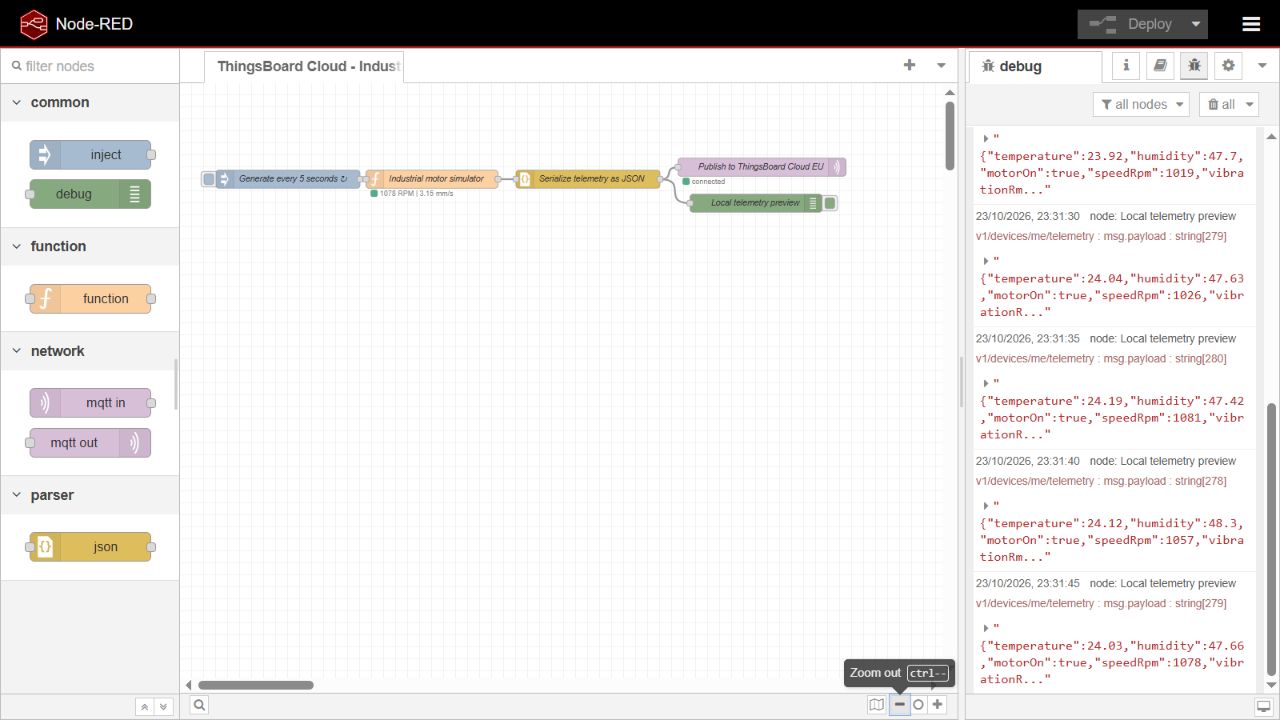
Inject → motor simulation → JSON → ThingsBoard MQTT, with Debug samples.
Import only the JSON project. It contains the complete Industrial motor simulator Function. The plain-text source under Resources is optional; do not add another simulator.The Inject node starts each sample. The Function calculates the motor readings, JSON serialization prepares the message, and the MQTT node sends it to ThingsBoard. Debug lets you inspect the same readings locally.
2
Link the motor device
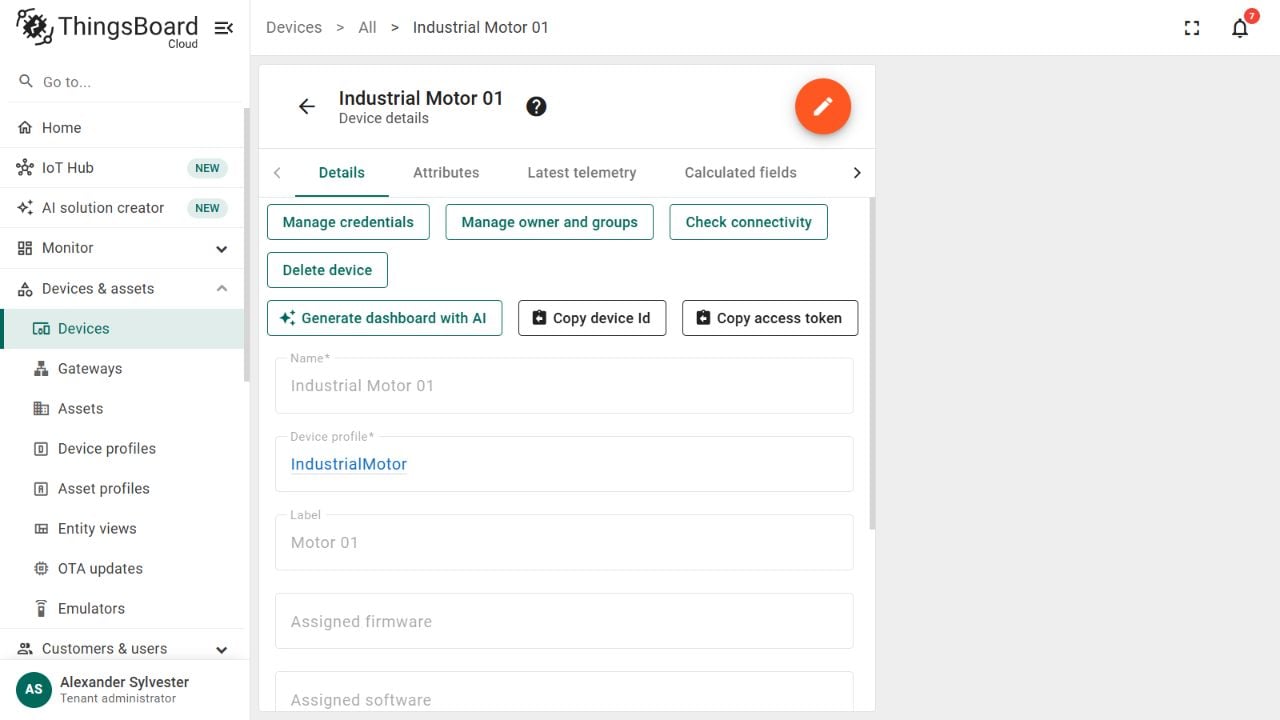
In ThingsBoard, open Devices & assets → Devices → Industrial Motor 01. Select Manage credentials → Access token → Copy access token, or use its Copy access token shortcut.
The motor device's credential controls.
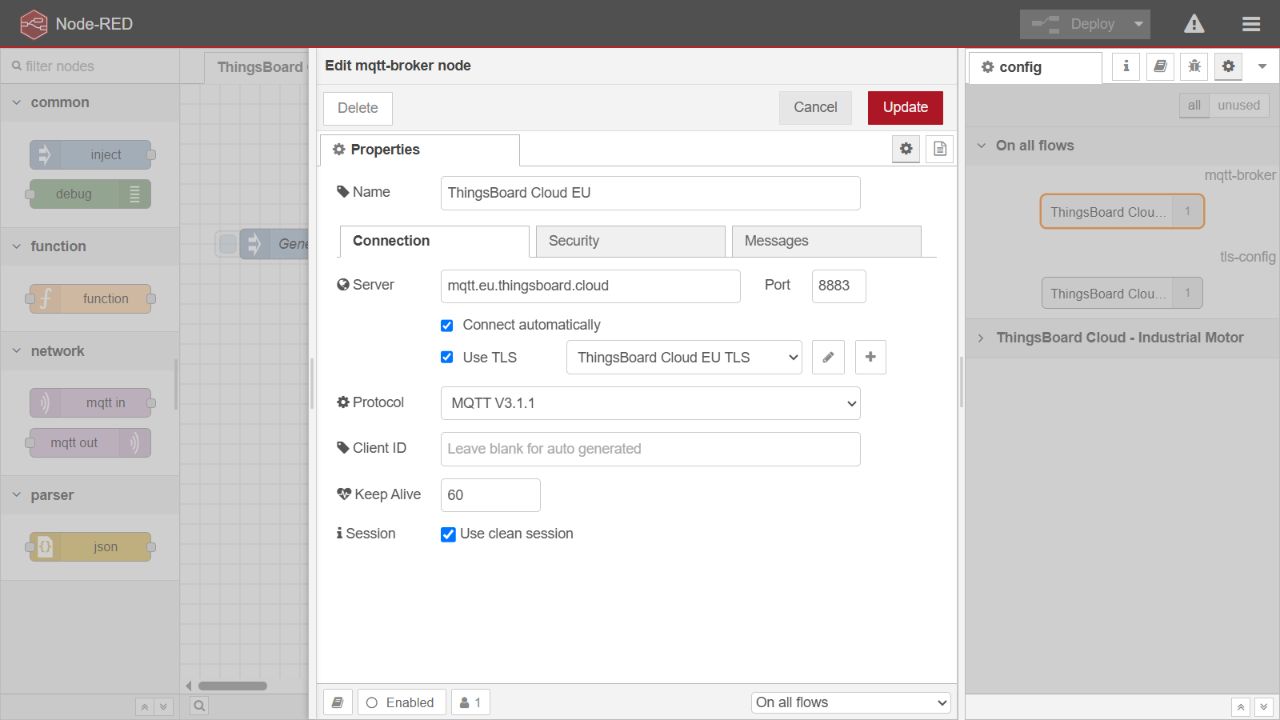
New to device access tokens? The Edge Setup guide shows step by step where to find a device’s MQTT connection details.In Node-RED, double-click Publish to ThingsBoard Cloud EU and edit its Server configuration. The download already has these connection settings; enter only your token under Security → Username:
Setting
Value
Server
mqtt.eu.thingsboard.cloud
Port
8883
TLS
Enabled, with server certificate verification
Security → Username
Your motor device access token
Security → Password
Leave blank
Topic
v1/devices/me/telemetry
QoS / Retain
1 / false
MQTT uses port 8883 with TLS and certificate verification.
Click Update → Done → Deploy. The Inject node sends every 5 seconds. Check that MQTT shows connected.If it stays disconnected, recheck the hostname, token and internet connection. Use the token belonging to Industrial Motor 01, not another device: that token determines which device receives the data.
Keep your token private. Never disable certificate verification or include the token in shared project files.
3
Check the data in ThingsBoard
Open Devices & assets in ThingsBoard.
Click Devices.
Open Industrial Motor 01.
Click Latest telemetry.
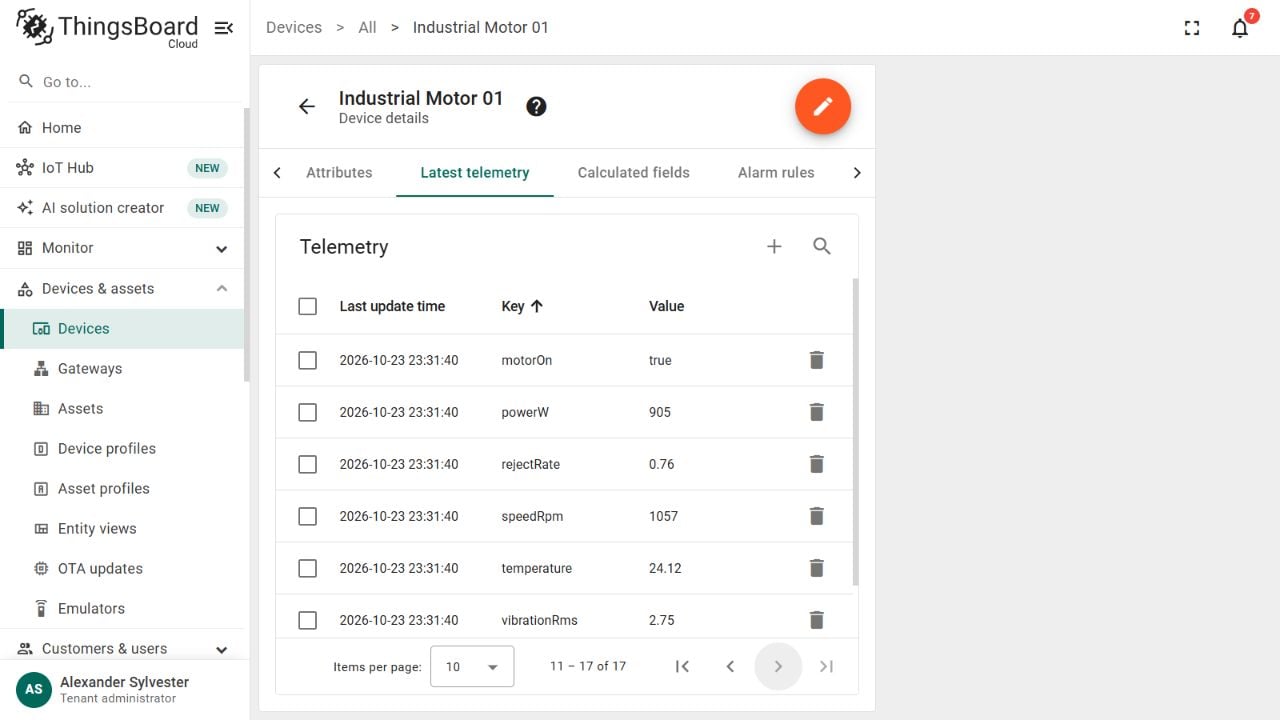
Find speedRpm, the simulated motor speed.
Watch its value and Last update time for at least 15 seconds. Timestamps should advance every 5 seconds.
Open Dashboards.
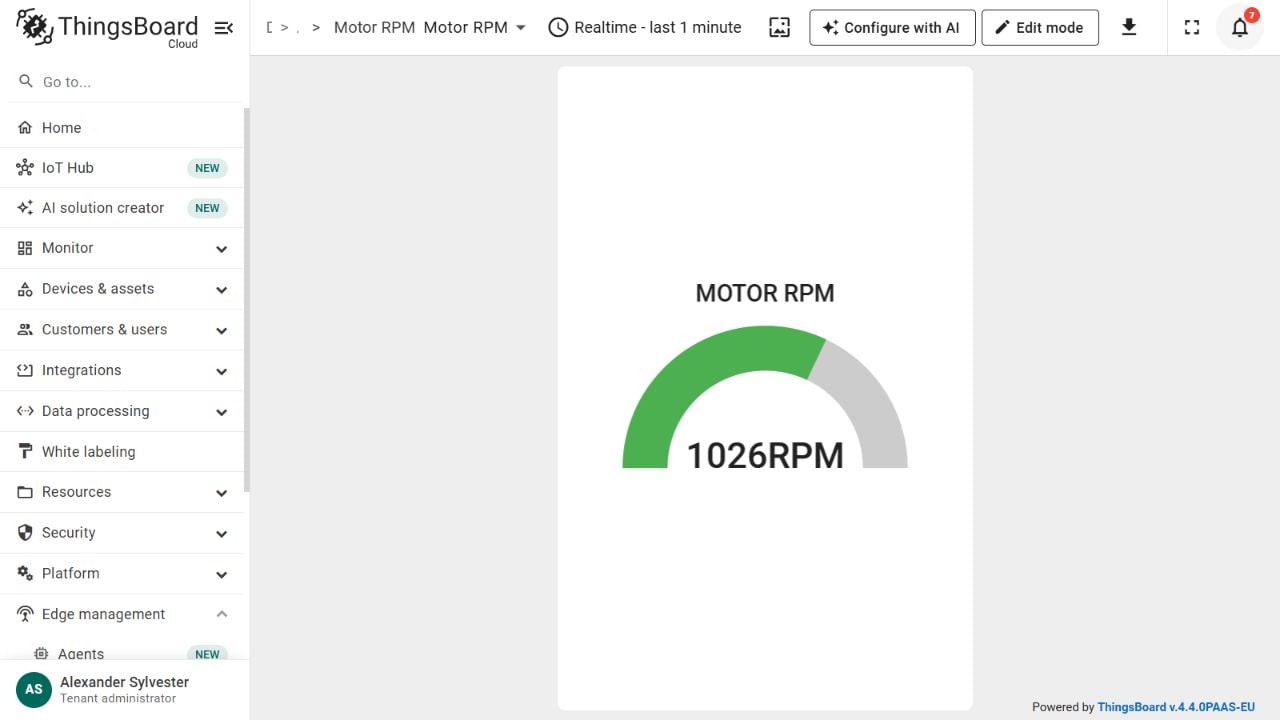
Open Motor RPM to see the gauge follow the speed.
Latest speedRpm and its update time.
Briefly pause the local publisher: timestamps should stop, then resume when you restart it. 0 RPM can simply mean that the simulated motor is stopped.
AI layouts can vary. Use the same telemetry keys and supported widgets; the arrangement need not match the images exactly.
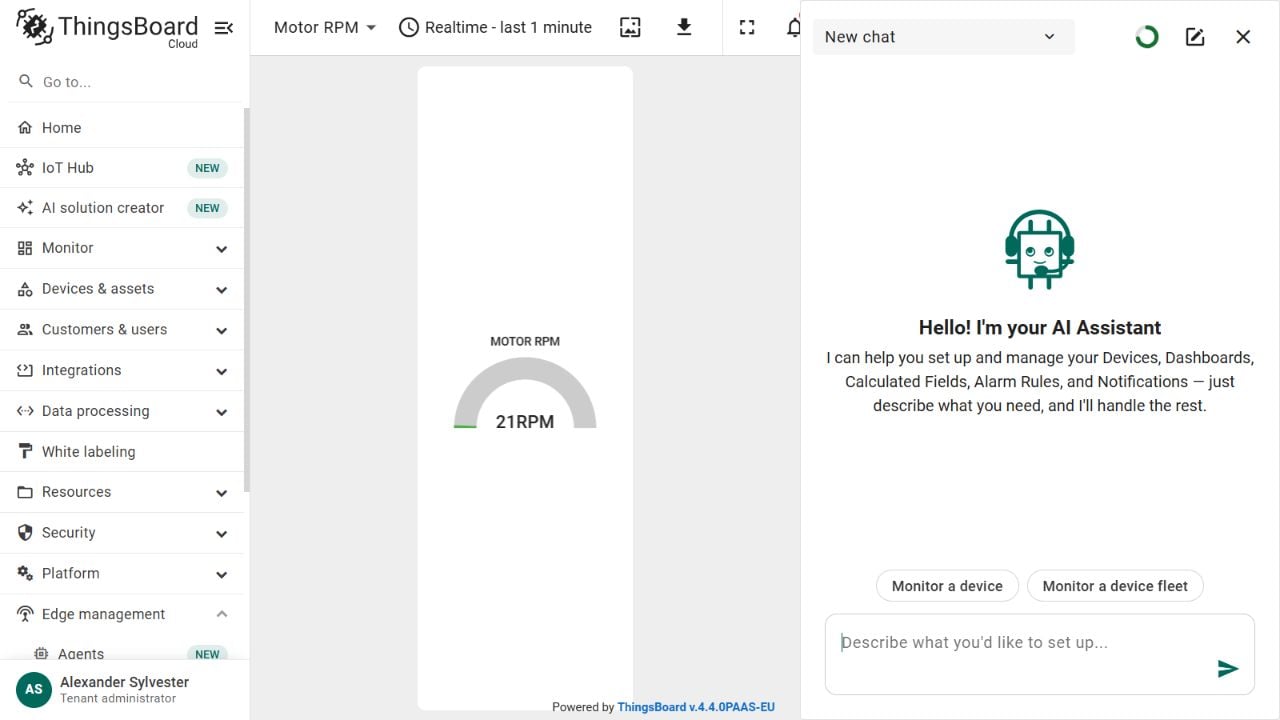
Open Motor RPM and click Configure with AI. Keep the existing device and refine the installed dashboard; do not click Create Solution again.Use built-in status cards, a ring or arc RPM gauge, charts and navigation. Keep the main screen focused on motor health; the Details view holds the secondary measurements.
Configure with AI opens beside the dashboard.
Paste this prompt:
Update this dashboard for the existing IndustrialMotor 01. Rename it Motor Overview and keep the samedevice alias and live MQTT telemetry.Make a compact industrial panel using built-in widgetsand their default card appearance:Top: four compact horizontal label-and-value cardsfor voltageV (V), currentA (A), powerW (W) andenergyKWh (kWh). Avoid square cards with cramped text.Middle: standard status cards for Motor Status frommotorOn and Motor Fault from fault on the left.In the centre, use a basic ring or arc gauge for thelatest speedRpm, with a scale from 0 to 1600 RPM.On the right, add a wide orange vibrationRms chart.Use a real-time telemetry window of the last 1 minutewith no aggregation, so a short demo shows raw values.Show minimum, maximum, average and latest vibration.Bottom: a compact device Alarms Table showing time,type, severity and status, including cleared history.Move temperature, humidity, availability, cycleCount,cycleTimeSec, goodParts, rejectRate, faultCode andalarmLevel, plus the speedRpm trend, into a Detailsstate. Use compact horizontal value cards there too.Add small Details and Back navigation buttons.Keep it readable and uncluttered. Reuse built-inwidgets. Do not create devices, emulators, motorcontrols, notifications or alarm rules in this step.Show the proposed changes for approval.
Review each proposal, Approve the intended changes, and save. Check readability; request horizontal label-and-value cards if square cards make values too small.Check the rendered dashboard, not just the text proposal. Its widgets must still point to the existing motor device, with readings updating from Node-RED.Read cycle time only while motorOn=true: the simulator sends null for cycleTimeSec while stopped, and a widget may retain its last non-null value.To view your larger dashboard:
Open Dashboards.
Open Motor Overview.
Watch the electrical values, RPM gauge and vibration chart change as the simulation runs.
Click Details to see the secondary measurements.
Click Back to return to the overview.
Motor Overview showing simulated readings and cleared alarms.
An Alarms Table displays alarms; the rules below create them.
1
Open the alarm assistant
Open Alarms → Alarm rules → Configure with AI. Confirm that the assistant targets Industrial Motor 01 before approving any changes.
The three motor alarm rules.
2
Give the alarm prompt
Create or update three alarm rules for the existingdevice Industrial Motor 01. Use latest telemetry,immediate conditions and an always-active schedule.Motor Fault: CRITICAL when fault=true.Clear when fault=false.High Vibration: WARNING when vibrationRms >7 and <=9;CRITICAL when vibrationRms >9. Clear when <=7 mm/s.High Temperature: WARNING when temperature >30 °C.Clear when temperature <=30 °C.Treat missing data as unknown, not zero or false.Reuse matching rules; do not create duplicate devicesor alarms. Show me the proposed changes for approval.Do not add email, SMS or other notification actions.
Check the target device, severities, and clear conditions before approving:
Alarm
Trigger
Clear
Motor Fault
fault=true → CRITICAL
fault=false
High Vibration
>7 and <=9 → WARNING; >9 → CRITICAL
<=7 mm/s
High Temperature
>30 °C → WARNING
<=30 °C
Vibration uses one alarm type; Critical takes priority above 9 mm/s. Check device/profile scope and reuse matching rules, avoiding duplicates. These are simulation thresholds, not real-motor operating limits.
Want to compare with hand-built alarm rules?Step 5 of the Vibration Monitoring guide configures ISO 10816 alarm rules manually on a device profile, using real sensor data and calculated fields.
3
Check the result
Return to Motor Overview. Its Alarms Table must use the same device and show active and cleared alarms to reveal automatic clearing.The normal simulation may not cross every threshold during your check. Use the two controlled payloads below to demonstrate both alarm creation and clearing, then restore the repeating simulation.Pause the repeating Inject and startup injection, then Deploy. Add a non-repeating Inject with a JSON payload, connected directly to Serialize telemetry as JSON. Send:
Unrequested resources: Review proposals and remove extras before approving.
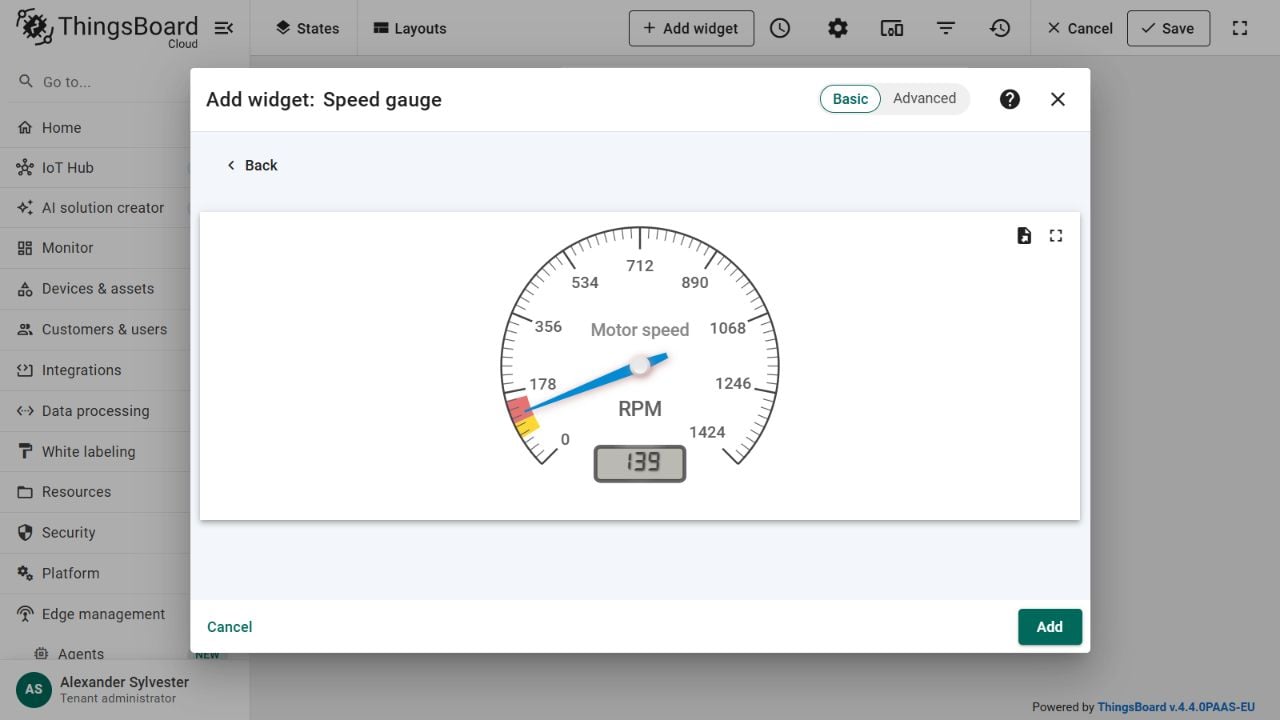
Needle gauge: AI cannot select the analogue Speed gauge. Use the optional manual instructions below, or see the ISO-banded Speed gauge built by hand in the Vibration Monitoring guide.
Font size and scaling: These controls are not exposed in this AI workflow; use Edit mode when available.
Alarm history: AI cannot set a separate Alarms Table time window here. Select a longer global dashboard window for older alarms.
Rule scope: AI may attach rules to a device profile, affecting every device using it. Confirm the intended scope.
Your result – a bigger dashboard using AI-supported widgets
You now have electrical readings, motor status, speed, vibration, Details navigation and alarms that activate and clear. This completes the AI workflow.
Motor Overview with electrical readings, status cards, RPM, vibration and alarm history.
Optional manual editing
Use Edit mode for optional appearance changes, separate from the AI prompts and opening GIF. See Edge Setup Step 5: Create Dashboard for widget basics.To add a needle gauge, open Edit mode → Add widget → Analogue gauges → Speed gauge. Use the existing motor alias and speedRpm; set RPM, min 0, max 1600, and 0 decimal digits, then enable the digital value. For the pictured style, use Motor speed as the Units title, #048AD3 for Arrow and scale default color, and white for Plate color. Replace the old RPM widget and Save. See the Speed gauge guide.
The optional needle gauge in the manual widget preview.
The complete flow: five-second Inject, motor simulator Function, JSON serialization, secure MQTT output and Debug. Add only your device access token after import.
The Node-RED flow, the AI-generated Motor Overview dashboard export, all three alarm definitions and a README with import notes. No tokens or telemetry history are included.
motor-ai-example-project.zip
To learn how to import a dashboard and update its entity alias, refer to ThingsBoard (Edge Setup). Alarm rules are not part of the dashboard export; recreate them in your account with Step 5.
I regularly test industrial automation and IIoT devices. If you’d like me to review your product or showcase it in my courses and YouTube channel:Email: rajvir@codeandcompile.com or drop me a message on LinkedIn
Was this page helpful?
{"docsConfig":{"theme":"mint","$schema":"https://mintlify.com/docs.json","name":"Code and Compile Wiki","description":"Free wiki for industrial automation and IIoT: PLC course resources, hands-on product reviews and free calculators for PLC, drives and IIoT engineers.","colors":{"primary":"#F78F3F","light":"#FF9843","dark":"#D9702A"},"favicon":"https://mintcdn.com/code-and-compile/AVgt2ILUleJ-6Ioq/images/caclogo.png?fit=max\u0026auto=format\u0026n=AVgt2ILUleJ-6Ioq\u0026q=85\u0026s=ab79a7d81b53c57c05cbe93a32ee985b","navbar":{"primary":{"type":"button","label":"Get my courses – 20% OFF","href":"/who-am-i/get-my-courses-20-off"}},"footer":{"socials":{"youtube":"https://www.youtube.com/thegeterrdone","linkedin":"https://www.linkedin.com/in/singhrajvir","instagram":"https://www.instagram.com/rajvir.codeandcompile","website":"https://www.codeandcompile.com"},"links":[{"header":"Learn","items":[{"label":"All courses","href":"https://learn.codeandcompile.com/l/products"},{"label":"Get 20% off","href":"/who-am-i/get-my-courses-20-off"},{"label":"Course resources","href":"/resources/based-on-courses"}]},{"header":"Free tools","items":[{"label":"PID tuning simulator","href":"/tools/pid-simulator"},{"label":"Modbus RTU frame builder","href":"/tools/modbus-rtu-frame-builder"},{"label":"IP subnet checker","href":"/tools/ip-subnet-checker"},{"label":"All tools","href":"/tools"}]},{"header":"Reviews","items":[{"label":"Smart devices","href":"/product-reviews/smart-devices"},{"label":"Smart platforms","href":"/product-reviews/smart-platforms"}]},{"header":"Work with me","items":[{"label":"Content creation","href":"https://codeandcompile.com/content-creation"},{"label":"Contact","href":"https://codeandcompile.com/contact"},{"label":"Cookie settings","href":"/"}]}]},"seo":{"metatags":{"canonical":"https://wiki.codeandcompile.com"},"indexing":"all"},"banner":{"content":"**New course: OpenPLC Made Easy.** Get 20% off with code WIKI. [View course](https://learn.codeandcompile.com/l/pdp/openplc-made-easy)","dismissible":true,"color":{"light":"#B85A1C","dark":"#8A4313"}},"errors":{"404":{"redirect":false,"title":"This page moved or doesn't exist","description":"Try the search above, or start from [Course resources](/resources/based-on-courses), [Product reviews](/product-reviews/smart-devices) or the [homepage](/)."}},"thumbnails":{"preset":"headline","appearance":"dark","surface":"brand","fonts":{"family":"Inter"},"eyebrow":{"source":"tab","style":"pill"}},"styling":{"latex":true},"navigation":{"pages":[]}},"deployment":{"deploymentMetadataValue":{"subdomain":"code-and-compile","hasAudioNarration":true,"actualSubdomain":"code-and-compile","customDomains":["wiki.codeandcompile.com"],"gitSource":{"type":"github","owner":"code-and-compile","repo":"mintlify-docs","deployBranch":"main","contentDirectory":"","isPrivate":true,"mountPath":"","label":"","_id":"6af2fff81580bcb16605c19d"},"feedback":{"thumbs":true,"edits":false,"issues":false},"entitlements":{"AI_CHAT":{"status":"ENABLED"},"WEB_MCP":{"status":"ENABLED"},"NARRATION":{"status":"ENABLED"}},"buildId":"6af367cf0e8abdf152c2d9f0","clientVersion":"0.0.4102","searchFilterCounts":[{"language":"default","tag":"Product reviews","count":49},{"language":"default","tag":"Course resources","count":37},{"language":"default","tag":"Smart devices","count":28},{"language":"default","tag":"Factory automation","count":27},{"language":"default","tag":"Smart platforms","count":23},{"language":"default","tag":"PLC","count":16},{"language":"default","tag":"Controllers and HMIs","count":12},{"language":"default","tag":"IoT platforms and alerts","count":10},{"language":"default","tag":"ctrlX CORE","count":9},{"language":"default","tag":"Free tools","count":9}]},"assistantConfig":{"enableAskAiButton":false,"enableStarterQuestions":false,"enableContextualStarterQuestions":false,"enableAskAiSearchBar":true},"basePath":"","hasChatPermissions":true,"hasWebMcpPermissions":true,"toggles":[{"name":"kill-isr","enabled":true,"variant":{"name":"disabled","enabled":false,"feature_enabled":true},"impressionData":false},{"name":"custom-rbac-roles","enabled":true,"variant":{"name":"disabled","enabled":false,"feature_enabled":true},"impressionData":false},{"name":"agent-mintlify-slack","enabled":true,"variant":{"name":"disabled","enabled":false,"feature_enabled":true},"impressionData":false},{"name":"agent-integrations-settings","enabled":true,"variant":{"name":"disabled","enabled":false,"feature_enabled":true},"impressionData":false},{"name":"rbac-expansion","enabled":true,"variant":{"name":"disabled","enabled":false,"feature_enabled":true},"impressionData":false},{"name":"automations-pr-grouping","enabled":true,"variant":{"name":"disabled","enabled":false,"feature_enabled":true},"impressionData":false},{"name":"custom-prefix","enabled":true,"variant":{"name":"disabled","enabled":false,"feature_enabled":true},"impressionData":false},{"name":"analytics-v7","enabled":true,"variant":{"name":"disabled","enabled":false,"feature_enabled":true},"impressionData":false},{"name":"user-flows-analytics","enabled":true,"variant":{"name":"disabled","enabled":false,"feature_enabled":true},"impressionData":false},{"name":"no-publish-flow","enabled":true,"variant":{"name":"disabled","enabled":false,"feature_enabled":true},"impressionData":false},{"name":"workos-onboarding","enabled":true,"variant":{"name":"disabled","enabled":false,"feature_enabled":true},"impressionData":false},{"name":"llms-txt-v2","enabled":true,"variant":{"name":"disabled","enabled":false,"feature_enabled":true},"impressionData":false},{"name":"snapshot-serving-live","enabled":true,"variant":{"name":"disabled","enabled":false,"feature_enabled":true},"impressionData":false},{"name":"stripTemperatureMiddleware","enabled":true,"variant":{"name":"disabled","enabled":false,"feature_enabled":true},"impressionData":false},{"name":"support-platform-pylon-zendesk","enabled":true,"variant":{"name":"disabled","enabled":false,"feature_enabled":true},"impressionData":false},{"name":"snapshot-serving","enabled":true,"variant":{"name":"disabled","enabled":false,"feature_enabled":true},"impressionData":false},{"name":"instant-rollback","enabled":true,"variant":{"name":"disabled","enabled":false,"feature_enabled":true},"impressionData":false},{"name":"granular-notifications-server","enabled":true,"variant":{"name":"disabled","enabled":false,"feature_enabled":true},"impressionData":false},{"name":"granular-notifications","enabled":true,"variant":{"name":"disabled","enabled":false,"feature_enabled":true},"impressionData":false},{"name":"automations-fable","enabled":true,"variant":{"name":"disabled","enabled":false,"feature_enabled":true},"impressionData":false},{"name":"fixed-ai-action-pricing","enabled":true,"variant":{"name":"disabled","enabled":false,"feature_enabled":true},"impressionData":false},{"name":"automation-resolve-merge-conflict","enabled":true,"variant":{"name":"disabled","enabled":false,"feature_enabled":true},"impressionData":false},{"name":"scoped-publishing","enabled":true,"variant":{"name":"disabled","enabled":false,"feature_enabled":true},"impressionData":false},{"name":"mintql","enabled":true,"variant":{"name":"disabled","enabled":false,"feature_enabled":true},"impressionData":false},{"name":"page-level-analytics","enabled":true,"variant":{"name":"disabled","enabled":false,"feature_enabled":true},"impressionData":false},{"name":"editor-version-history-v2","enabled":true,"variant":{"name":"disabled","enabled":false,"feature_enabled":true},"impressionData":false},{"name":"billing-page-v2","enabled":true,"variant":{"name":"disabled","enabled":false,"feature_enabled":true},"impressionData":false},{"name":"full-page-search","enabled":true,"variant":{"name":"disabled","enabled":false,"feature_enabled":true},"impressionData":false},{"name":"workspace-projects","enabled":true,"variant":{"name":"disabled","enabled":false,"feature_enabled":true},"impressionData":false},{"name":"assistant-v5","enabled":true,"variant":{"name":"disabled","enabled":false,"feature_enabled":true},"impressionData":false},{"name":"fork-pr-previews","enabled":true,"variant":{"name":"disabled","enabled":false,"feature_enabled":true},"impressionData":false},{"name":"revalidation-jwt","enabled":true,"variant":{"name":"disabled","enabled":false,"feature_enabled":true},"impressionData":false},{"name":"workos-sso-scim","enabled":true,"variant":{"name":"disabled","enabled":false,"feature_enabled":true},"impressionData":false},{"name":"hobby-abuse-scan","enabled":true,"variant":{"name":"disabled","enabled":false,"feature_enabled":true},"impressionData":false},{"name":"dashboard-inbox","enabled":true,"variant":{"name":"disabled","enabled":false,"feature_enabled":true},"impressionData":false},{"name":"workos-signup","enabled":true,"variant":{"name":"disabled","enabled":false,"feature_enabled":true},"impressionData":false},{"name":"turbopuffer-dual-write","enabled":true,"variant":{"name":"disabled","enabled":false,"feature_enabled":true},"impressionData":false},{"name":"workos-enabled","enabled":true,"variant":{"name":"disabled","enabled":false,"feature_enabled":true},"impressionData":false},{"name":"approve-review-flow","enabled":true,"variant":{"name":"disabled","enabled":false,"feature_enabled":true},"impressionData":false},{"name":"editor-metadata","enabled":true,"variant":{"name":"disabled","enabled":false,"feature_enabled":true},"impressionData":false},{"name":"sso-setup-deadline-banner","enabled":true,"variant":{"name":"disabled","enabled":false,"feature_enabled":true},"impressionData":false},{"name":"turbopuffer-serve","enabled":true,"variant":{"name":"disabled","enabled":false,"feature_enabled":true},"impressionData":false},{"name":"live-agents","enabled":true,"variant":{"name":"disabled","enabled":false,"feature_enabled":true},"impressionData":false}],"googleFontsInlined":false},"customCss":[{"filePath":"style.css","content":"#content-area:has(img[src*=\"wiki-banner\"])>#header{position:absolute!important;width:1px;height:1px;overflow:hidden;clip:rect(0 0 0 0);white-space:nowrap}.cc-banner-mobile{display:none}@media (max-width: 640px){.cc-banner-desktop{display:none}.cc-banner-mobile{display:block}}#cc-consent{position:fixed;z-index:9999;left:16px;right:16px;bottom:16px;max-width:380px;display:flex;flex-wrap:wrap;gap:12px;align-items:center;justify-content:space-between;padding:14px 16px;border-radius:12px;font-size:14px;line-height:1.45;background:#ffffff;color:#12131a;border:1px solid rgba(0,0,0,.12);box-shadow:0 10px 30px rgba(0,0,0,.15)}.dark #cc-consent{background:#16171c;color:#f4f5f7;border-color:rgba(255,255,255,.12);box-shadow:0 10px 30px rgba(0,0,0,.5)}#cc-consent p{margin:0;flex:1 1 100%}#cc-consent .cc-actions{margin-left:auto}#cc-consent a{color:#F78F3F;text-decoration:underline}#cc-consent .cc-actions{display:flex;gap:8px}#cc-consent button{font:inherit;font-weight:600;padding:8px 16px;border-radius:8px;cursor:pointer}#cc-consent .cc-decline{background:transparent;color:inherit;border:1px solid rgba(127,127,127,.4)}#cc-consent .cc-accept{background:#F78F3F;color:#fff;border:1px solid #F78F3F}"}],"page":{"pagePath":"product-reviews/smart-platforms/thingsboard/from-prompt-to-live-dashboard-with-thingsboard-ai","slug":"/product-reviews/smart-platforms/thingsboard/from-prompt-to-live-dashboard-with-thingsboard-ai","pageMetadata":{"title":"From Prompt to Live Dashboard with ThingsBoard AI","description":"Build a live motor dashboard with ThingsBoard AI in about 90 minutes: one prompt for an RPM gauge, a Node-RED simulation over secure MQTT, an AI-expanded overview and AI-created alarm rules.","hidden":true,"href":"/product-reviews/smart-platforms/thingsboard/from-prompt-to-live-dashboard-with-thingsboard-ai","hiddenSetByFrontmatter":true},"description":{"compiledSource":"\"use strict\";\nconst {jsx: _jsx} = arguments[0];\nconst {useMDXComponents: _provideComponents} = arguments[0];\nfunction _createMdxContent(props) {\n const _components = {\n p: \"p\",\n ..._provideComponents(),\n ...props.components\n };\n return _jsx(_components.p, {\n children: \"Build a live motor dashboard with ThingsBoard AI in about 90 minutes: one prompt for an RPM gauge, a Node-RED simulation over secure MQTT, an AI-expanded overview and AI-created alarm rules.\"\n });\n}\nfunction MDXContent(props = {}) {\n const {wrapper: MDXLayout} = {\n ..._provideComponents(),\n ...props.components\n };\n return MDXLayout ? _jsx(MDXLayout, {\n ...props,\n children: _jsx(_createMdxContent, {\n ...props\n })\n }) : _createMdxContent(props);\n}\nreturn {\n default: MDXContent\n};\n","frontmatter":{},"scope":{}},"pageType":"default","mdx":{"mdxSource":{"compiledSource":"\"use strict\";const{Fragment:_Fragment,jsx:_jsx,jsxs:_jsxs}=arguments[0];const{useMDXComponents:_provideComponents}=arguments[0];function _createMdxContent(props){const _components={a:`a`,code:`code`,em:`em`,hr:`hr`,li:`li`,ol:`ol`,p:`p`,pre:`pre`,span:`span`,strong:`strong`,tbody:`tbody`,td:`td`,th:`th`,thead:`thead`,tr:`tr`,ul:`ul`,..._provideComponents(),...props.components},{Accordion,Card,CardGroup,Check,CodeBlock,Frame,Heading,Info,OptimizedImage,Step,Steps,Table,Warning}=_components;if(!Accordion)_missingMdxReference(`Accordion`,true);if(!Card)_missingMdxReference(`Card`,true);if(!CardGroup)_missingMdxReference(`CardGroup`,true);if(!Check)_missingMdxReference(`Check`,true);if(!CodeBlock)_missingMdxReference(`CodeBlock`,true);if(!Frame)_missingMdxReference(`Frame`,true);if(!Heading)_missingMdxReference(`Heading`,true);if(!Info)_missingMdxReference(`Info`,true);if(!OptimizedImage)_missingMdxReference(`OptimizedImage`,true);if(!Step)_missingMdxReference(`Step`,true);if(!Steps)_missingMdxReference(`Steps`,true);if(!Table)_missingMdxReference(`Table`,true);if(!Warning)_missingMdxReference(`Warning`,true);return _jsxs(_Fragment,{children:[_jsx(_components.p,{children:_jsx(_components.strong,{children:`Build a live motor dashboard with AI in about 90 minutes.`})}),`\n`,_jsx(_components.p,{children:`Start with one RPM gauge, then expand it with AI. Your PC sends simulated motor data from Node-RED; no physical motor is needed.`}),`\n`,_jsx(_components.p,{children:`You will use prompts to create the device, dashboard and alarm rules, then approve the proposed changes. Node-RED supplies the data; AI designs the display. Start with the simple gauge so you can check the connection before adding more widgets.`}),`\n`,_jsx(Info,{children:_jsxs(_components.p,{children:[_jsx(_components.strong,{children:`Part of the Code \u0026 Compile ThingsBoard series.`}),` `,_jsx(_components.a,{href:`/product-reviews/smart-platforms/thingsboard/thingsboard-edge-setup`,children:`ThingsBoard (Edge Setup)`}),` built the same simulated motor on a local ThingsBoard Edge, and `,_jsx(_components.a,{href:`/product-reviews/smart-platforms/thingsboard/real-time-vibration-monitoring-with-thingsboard-and-calculated-fields`,children:`Real-Time Vibration Monitoring with ThingsBoard and Calculated Fields`}),` used a real Balluff sensor with hand-built rules. This guide moves to ThingsBoard Cloud and lets AI do the dashboard and alarm work.`]})}),`\n`,_jsx(Frame,{children:_jsx(`video`,{autoPlay:true,loop:true,muted:true,playsInline:true,className:`mint-w-full mint-rounded-xl mint-mx-auto`,style:{aspectRatio:`720 / 720`,maxWidth:`460px`},src:`https://mintcdn.com/code-and-compile/yMX6sRFhjje4NRKW/videos/gif-motor-ai-overview.mp4?fit=max\u0026auto=format\u0026n=yMX6sRFhjje4NRKW\u0026q=85\u0026s=f4960166d5ea18083786d83ab5b67c05`,\"aria-label\":`AI-generated motor dashboard with changing RPM, electrical values, vibration history and cleared alarms, connected to a local Node-RED simulator over MQTT`,\"data-path\":`videos/gif-motor-ai-overview.mp4`})}),`\n`,_jsx(_components.p,{children:_jsx(_components.strong,{children:`By the end of this guide, you will have:`})}),`\n`,_jsxs(_components.ul,{children:[`\n`,_jsxs(_components.li,{children:[`Your local `,_jsx(_components.strong,{children:`Node-RED simulation`}),` connected to ThingsBoard Cloud over `,_jsx(_components.strong,{children:`MQTT`}),`.`]}),`\n`,_jsxs(_components.li,{children:[`A compact motor dashboard built with the `,_jsx(_components.strong,{children:`Configure with AI`}),` feature in ThingsBoard, including electrical readings and vibration trends.`]}),`\n`,_jsxs(_components.li,{children:[_jsx(_components.strong,{children:`Alarm conditions`}),` for motor faults, high vibration and high temperature.`]}),`\n`]}),`\n`,_jsxs(_components.p,{children:[`Allow `,_jsx(_components.strong,{children:`about 90 minutes`}),` for registration, Node-RED motor simulation setup and checks, or about 60 minutes if your ThingsBoard account and Node-RED are ready. Optional manual styling comes last.`]}),`\n`,_jsx(Heading,{level:`3`,id:`five-steps-from-your-first-prompt-to-alarms`,children:`Five steps, from your first prompt to alarms`}),`\n`,_jsxs(CardGroup,{cols:2,children:[_jsx(Card,{title:`Step 1: Create your account`,href:`/product-reviews/smart-platforms/thingsboard/from-prompt-to-live-dashboard-with-thingsboard-ai#step-1-create-your-cloud-account`,children:_jsx(_components.p,{children:`Sign in to ThingsBoard Cloud EU.`})}),_jsx(Card,{title:`Step 2: Prompt a simple gauge`,href:`/product-reviews/smart-platforms/thingsboard/from-prompt-to-live-dashboard-with-thingsboard-ai#step-2-create-a-simple-rpm-dashboard`,children:_jsx(_components.p,{children:`Create one motor device and an RPM dashboard.`})}),_jsx(Card,{title:`Step 3: Connect live simulation`,href:`/product-reviews/smart-platforms/thingsboard/from-prompt-to-live-dashboard-with-thingsboard-ai#step-3-connect-the-example-node-red-simulation`,children:_jsx(_components.p,{children:`Import our Node-RED flow and link it over MQTT.`})}),_jsx(Card,{title:`Step 4: Expand with AI`,href:`/product-reviews/smart-platforms/thingsboard/from-prompt-to-live-dashboard-with-thingsboard-ai#step-4-build-the-bigger-dashboard-with-ai`,children:_jsx(_components.p,{children:`Add readings, trends and a Details view.`})}),_jsx(Card,{title:`Step 5: Add and check alarms`,href:`/product-reviews/smart-platforms/thingsboard/from-prompt-to-live-dashboard-with-thingsboard-ai#step-5-add-alarm-conditions-with-ai`,children:_jsx(_components.p,{children:`Set fault, vibration and temperature conditions.`})})]}),`\n`,_jsx(Heading,{level:`3`,id:`before-you-start`,children:`Before you start`}),`\n`,_jsx(_components.p,{children:`Use these Code \u0026 Compile resources if you need the basics:`}),`\n`,_jsxs(_components.ul,{children:[`\n`,_jsxs(_components.li,{children:[_jsx(_components.strong,{children:`ThingsBoard:`}),` The `,_jsx(_components.a,{href:`/product-reviews/smart-platforms/thingsboard`,children:`introduction`}),` explains the platform; `,_jsx(_components.a,{href:`/product-reviews/smart-platforms/virtual-plcs/autonomy-edge-openplc-redefined/openplc-with-python-fb#thingsboard-cloud-setup`,children:`Cloud Setup`}),` covers registration and credentials.`]}),`\n`,_jsxs(_components.li,{children:[_jsx(_components.strong,{children:`Node-RED:`}),` Browse the `,_jsx(_components.a,{href:`/iiot/iiot-tools/node-red`,children:`learning resources`}),`. Install it using the official `,_jsx(_components.a,{href:`https://nodered.org/docs/getting-started/windows`,children:`Windows guide`}),` or `,_jsx(_components.a,{href:`https://nodered.org/docs/getting-started/`,children:`other installation options`}),`.`]}),`\n`,_jsxs(_components.li,{children:[_jsx(_components.strong,{children:`Edge demo:`}),` This guide reuses its `,_jsx(_components.a,{href:`/product-reviews/smart-platforms/thingsboard/thingsboard-edge-setup#step-3-add-a-new-device-and-send-a-test-value`,children:`MQTT example`}),` and `,_jsx(_components.a,{href:`/product-reviews/smart-platforms/thingsboard/thingsboard-edge-setup#step-4-update-telemetry-data-in-the-node-red`,children:`motor simulation`}),` as an importable flow. Here, `,_jsx(_components.strong,{children:`ThingsBoard Cloud EU`}),` and AI replace the local ThingsBoard setup. No PLC project or Python/HTTP example is needed.`]}),`\n`]}),`\n`,_jsxs(Check,{children:[_jsx(_components.p,{children:_jsx(_components.strong,{children:`Want to get started with ThingsBoard Cloud?`})}),_jsxs(_components.p,{children:[`Create an account or sign in `,_jsx(_components.a,{href:`https://eu.thingsboard.cloud/home`,children:`here`}),`.`]})]}),`\n`,_jsx(Heading,{level:`3`,id:`hardware-software-used`,children:`Hardware \u0026 Software Used`}),`\n`,_jsx(_components.p,{children:_jsx(_components.strong,{children:`Hardware`})}),`\n`,_jsxs(_components.ul,{children:[`\n`,_jsx(_components.li,{children:`Development PC / laptop with an internet connection. No physical motor is needed.`}),`\n`]}),`\n`,_jsx(_components.p,{children:_jsx(_components.strong,{children:`Software`})}),`\n`,_jsxs(_components.ul,{children:[`\n`,_jsxs(_components.li,{children:[`ThingsBoard Cloud EU with `,_jsx(_components.strong,{children:`Tenant Administrator`}),` access. The `,_jsx(_components.a,{href:`https://thingsboard.io/docs/paas/eu/reference/subscriptions/`,children:`EU Free plan includes 2.5 million monthly AI credits; Prototype includes 4 million`}),`. Free can complete this guide with sufficient remaining credits and device, telemetry, storage and alarm allowances. Check `,_jsx(_components.strong,{children:`API usage`}),` before Step 2; repeated AI changes consume more credits.`]}),`\n`,_jsxs(_components.li,{children:[_jsx(_components.a,{href:`https://nodered.org/docs/getting-started/`,children:`Node-RED`}),` running on your PC.`]}),`\n`,_jsx(_components.li,{children:`The example Node-RED project attached in Step 3.`}),`\n`]}),`\n`,_jsx(_components.p,{children:`Keep your Cloud account and Node-RED editor open in separate browser tabs. You will move between them to copy device credentials, publish data and check the dashboard.`}),`\n`,_jsx(_components.hr,{}),`\n`,_jsx(Heading,{level:`3`,id:`step-1-create-your-cloud-account`,children:`Step 1 – Create your Cloud account`}),`\n`,_jsxs(_components.p,{children:[`Open `,_jsx(_components.a,{href:`https://eu.thingsboard.cloud/home`,children:`ThingsBoard Cloud EU`}),`. Sign in or select `,_jsx(_components.strong,{children:`Sign up`}),`, complete registration, and verify your email.`]}),`\n`,_jsx(Frame,{caption:`ThingsBoard Cloud EU sign-in page.`,children:_jsx(OptimizedImage,{src:`https://mintcdn.com/code-and-compile/oJD_SnxirnRME6Em/images/tb-cloud-login.jpg?fit=max\u0026auto=format\u0026n=oJD_SnxirnRME6Em\u0026q=85\u0026s=193935a3dde01a843d040cceda9be740`,alt:`ThingsBoard Cloud EU login and Sign up page`,width:`563`,\"data-og-width\":`562`,\"data-og-height\":`676`,\"data-path\":`images/tb-cloud-login.jpg`,\"data-optimize\":`true`,\"data-opv\":`3`,srcset:`https://mintcdn.com/code-and-compile/oJD_SnxirnRME6Em/images/tb-cloud-login.jpg?w=280\u0026fit=max\u0026auto=format\u0026n=oJD_SnxirnRME6Em\u0026q=85\u0026s=c3c4726c4479b2bfd37bef77a3c9aab9 280w, https://mintcdn.com/code-and-compile/oJD_SnxirnRME6Em/images/tb-cloud-login.jpg?w=560\u0026fit=max\u0026auto=format\u0026n=oJD_SnxirnRME6Em\u0026q=85\u0026s=89277037d3fdb77812838663fceb84c2 560w, https://mintcdn.com/code-and-compile/oJD_SnxirnRME6Em/images/tb-cloud-login.jpg?w=840\u0026fit=max\u0026auto=format\u0026n=oJD_SnxirnRME6Em\u0026q=85\u0026s=b65252be0066c0384239b14ae58180a9 840w, https://mintcdn.com/code-and-compile/oJD_SnxirnRME6Em/images/tb-cloud-login.jpg?w=1100\u0026fit=max\u0026auto=format\u0026n=oJD_SnxirnRME6Em\u0026q=85\u0026s=b563f2d99f734186c9ed52457f206951 1100w, https://mintcdn.com/code-and-compile/oJD_SnxirnRME6Em/images/tb-cloud-login.jpg?w=1650\u0026fit=max\u0026auto=format\u0026n=oJD_SnxirnRME6Em\u0026q=85\u0026s=a86639978809618bf58c01209b1faf61 1650w, https://mintcdn.com/code-and-compile/oJD_SnxirnRME6Em/images/tb-cloud-login.jpg?w=2500\u0026fit=max\u0026auto=format\u0026n=oJD_SnxirnRME6Em\u0026q=85\u0026s=e6812fa4624a0dd67ed89adbba024832 2500w`})}),`\n`,_jsxs(_components.p,{children:[`Use `,_jsx(_components.strong,{children:`Tenant Administrator`}),` access. Let AI create `,_jsx(_components.strong,{children:`Industrial Motor 01`}),` in Step 2; do not manually add another device.`]}),`\n`,_jsx(Heading,{level:`3`,id:`step-2-create-a-simple-rpm-dashboard`,children:`Step 2 – Create a simple RPM dashboard`}),`\n`,_jsxs(Steps,{children:[_jsxs(Step,{title:`Enter the simple prompt`,children:[_jsxs(_components.p,{children:[`Open `,_jsx(_components.strong,{children:`AI solution creator → New solution`}),` and enter:`]}),_jsx(CodeBlock,{numberOfLines:`6`,language:`text`,children:_jsx(_components.pre,{className:`shiki shiki-themes github-light-default dark-plus`,style:{backgroundColor:`#ffffff`,\"--shiki-dark-bg\":`#0B0C0E`,color:`#1f2328`,\"--shiki-dark\":`#D4D4D4`},language:`text`,children:_jsxs(_components.code,{language:`text`,numberOfLines:`6`,children:[_jsx(_components.span,{className:`line`,children:_jsx(_components.span,{children:`Create a dashboard named Motor RPM for one device`})}),`\n`,_jsx(_components.span,{className:`line`,children:_jsx(_components.span,{children:`named Industrial Motor 01. Show only the latest`})}),`\n`,_jsx(_components.span,{className:`line`,children:_jsx(_components.span,{children:`speedRpm in a gauge from 0 to 1600 RPM.`})}),`\n`,_jsx(_components.span,{className:`line`,children:_jsx(_components.span,{children:`The data will come from my local Node-RED simulator`})}),`\n`,_jsx(_components.span,{className:`line`,children:_jsx(_components.span,{children:`over MQTT.`})}),`\n`,_jsx(_components.span,{className:`line`,children:_jsx(_components.span,{})})]})})}),_jsx(Frame,{caption:`The simple prompt in AI Solution Creator.`,children:_jsx(OptimizedImage,{src:`https://mintcdn.com/code-and-compile/oJD_SnxirnRME6Em/images/tb-simple-prompt.jpg?fit=max\u0026auto=format\u0026n=oJD_SnxirnRME6Em\u0026q=85\u0026s=ad905b2905edacb444b7c65b713a74c2`,alt:`Motor RPM prompt in AI Solution Creator`,width:`563`,\"data-og-width\":`1280`,\"data-og-height\":`720`,\"data-path\":`images/tb-simple-prompt.jpg`,\"data-optimize\":`true`,\"data-opv\":`3`,srcset:`https://mintcdn.com/code-and-compile/oJD_SnxirnRME6Em/images/tb-simple-prompt.jpg?w=280\u0026fit=max\u0026auto=format\u0026n=oJD_SnxirnRME6Em\u0026q=85\u0026s=78b3e0dea9391e00ab8fd3b81990ba3b 280w, https://mintcdn.com/code-and-compile/oJD_SnxirnRME6Em/images/tb-simple-prompt.jpg?w=560\u0026fit=max\u0026auto=format\u0026n=oJD_SnxirnRME6Em\u0026q=85\u0026s=efa32924892115f15095502a36055f17 560w, https://mintcdn.com/code-and-compile/oJD_SnxirnRME6Em/images/tb-simple-prompt.jpg?w=840\u0026fit=max\u0026auto=format\u0026n=oJD_SnxirnRME6Em\u0026q=85\u0026s=aa3f195e6fc1d6df74b05240d32cabb7 840w, https://mintcdn.com/code-and-compile/oJD_SnxirnRME6Em/images/tb-simple-prompt.jpg?w=1100\u0026fit=max\u0026auto=format\u0026n=oJD_SnxirnRME6Em\u0026q=85\u0026s=0b492d419175faa6e52c90293673c5e5 1100w, https://mintcdn.com/code-and-compile/oJD_SnxirnRME6Em/images/tb-simple-prompt.jpg?w=1650\u0026fit=max\u0026auto=format\u0026n=oJD_SnxirnRME6Em\u0026q=85\u0026s=24ba68cb2c4e93031dafd1f9f9bf8848 1650w, https://mintcdn.com/code-and-compile/oJD_SnxirnRME6Em/images/tb-simple-prompt.jpg?w=2500\u0026fit=max\u0026auto=format\u0026n=oJD_SnxirnRME6Em\u0026q=85\u0026s=283f1a973a3d8c1423e7d07f38910da3 2500w`})})]}),_jsxs(Step,{title:`Review and create the solution`,children:[_jsxs(_components.p,{children:[`Select `,_jsx(_components.strong,{children:`Skip interview`}),` if offered. Check the proposed device name, `,_jsx(_components.strong,{children:`speedRpm`}),` key, and `,_jsx(_components.strong,{children:`0–1600 RPM`}),` gauge. The telemetry key is the name Node-RED sends; it must match exactly, including capital letters.`]}),_jsxs(_components.p,{children:[_jsx(_components.strong,{children:`Review the full proposal.`}),` Approve only one motor device and its RPM dashboard. Ask AI to remove unrequested users, roles, assets, devices, calculated fields, alarm rules or emulators before installing; alarms come in Step 5.`]}),_jsxs(_components.p,{children:[`Continue through `,_jsx(_components.strong,{children:`Dashboard Design`}),`, then click `,_jsx(_components.strong,{children:`Create Solution`}),`.`]}),_jsxs(_components.p,{children:[`Open `,_jsx(_components.strong,{children:`Motor RPM`}),`. Connect Node-RED next to supply its data.`]})]})]}),`\n`,_jsxs(_components.p,{children:[`Already have a motor dashboard? Export a backup, then use `,_jsx(_components.strong,{children:`Configure with AI`}),` on it instead of installing another solution.`]}),`\n`,_jsx(Heading,{level:`3`,id:`step-3-connect-the-example-node-red-simulation`,children:`Step 3 – Connect the example Node-RED simulation`}),`\n`,_jsxs(_components.p,{children:[`The attached flow packages the Edge demo’s motor simulation with a secure MQTT connection. Install Node-RED first using the links under `,_jsx(_components.strong,{children:`Before you start`}),`.`]}),`\n`,_jsxs(Steps,{children:[_jsxs(Step,{title:`Import the project`,children:[_jsxs(_components.p,{children:[`Start Node-RED and open `,_jsx(_components.a,{href:`http://localhost:1880`,children:`localhost:1880`}),`. Select `,_jsx(_components.strong,{children:`Menu → Import`}),`, choose the attached JSON project, and click `,_jsx(_components.strong,{children:`Import`}),`. Reuse the existing flow if it is already imported; running two copies would publish duplicate samples.`]}),_jsx(Card,{title:`industrial-motor-cloud-flow.json`,icon:`download`,href:`https://raw.githubusercontent.com/Code-and-Compile/wiki-docs/main/wiki/.gitbook/assets/industrial-motor-cloud-flow.json`}),_jsx(Frame,{caption:`Inject → motor simulation → JSON → ThingsBoard MQTT, with Debug samples.`,children:_jsx(OptimizedImage,{src:`https://mintcdn.com/code-and-compile/oJD_SnxirnRME6Em/images/tb-node-red-flow.jpg?fit=max\u0026auto=format\u0026n=oJD_SnxirnRME6Em\u0026q=85\u0026s=551bc981bd8a0d278b9f6f4800949e29`,alt:`Node-RED motor simulation flow with MQTT output and Debug samples`,width:`563`,\"data-og-width\":`1280`,\"data-og-height\":`720`,\"data-path\":`images/tb-node-red-flow.jpg`,\"data-optimize\":`true`,\"data-opv\":`3`,srcset:`https://mintcdn.com/code-and-compile/oJD_SnxirnRME6Em/images/tb-node-red-flow.jpg?w=280\u0026fit=max\u0026auto=format\u0026n=oJD_SnxirnRME6Em\u0026q=85\u0026s=05ecce5af7813c2be6224e7d01242c67 280w, https://mintcdn.com/code-and-compile/oJD_SnxirnRME6Em/images/tb-node-red-flow.jpg?w=560\u0026fit=max\u0026auto=format\u0026n=oJD_SnxirnRME6Em\u0026q=85\u0026s=47ed06eb6c4df5efc1e2f79d7bfafe81 560w, https://mintcdn.com/code-and-compile/oJD_SnxirnRME6Em/images/tb-node-red-flow.jpg?w=840\u0026fit=max\u0026auto=format\u0026n=oJD_SnxirnRME6Em\u0026q=85\u0026s=8d71e81b07ff79b7de91e5e2cfaffcb4 840w, https://mintcdn.com/code-and-compile/oJD_SnxirnRME6Em/images/tb-node-red-flow.jpg?w=1100\u0026fit=max\u0026auto=format\u0026n=oJD_SnxirnRME6Em\u0026q=85\u0026s=042cd768d4f2ca9500454d6d5b920247 1100w, https://mintcdn.com/code-and-compile/oJD_SnxirnRME6Em/images/tb-node-red-flow.jpg?w=1650\u0026fit=max\u0026auto=format\u0026n=oJD_SnxirnRME6Em\u0026q=85\u0026s=da384cf61d08d52d118d2310b7dd43a3 1650w, https://mintcdn.com/code-and-compile/oJD_SnxirnRME6Em/images/tb-node-red-flow.jpg?w=2500\u0026fit=max\u0026auto=format\u0026n=oJD_SnxirnRME6Em\u0026q=85\u0026s=50fc8ab89612cb3c89a406660dd1f31f 2500w`})}),_jsxs(_components.p,{children:[_jsx(_components.strong,{children:`Import only the JSON project.`}),` It contains the complete `,_jsx(_components.code,{children:`Industrial motor simulator`}),` Function. The plain-text source under `,_jsx(_components.strong,{children:`Resources`}),` is optional; do not add another simulator.`]}),_jsx(_components.p,{children:`The Inject node starts each sample. The Function calculates the motor readings, JSON serialization prepares the message, and the MQTT node sends it to ThingsBoard. Debug lets you inspect the same readings locally.`})]}),_jsxs(Step,{title:`Link the motor device`,children:[_jsxs(_components.p,{children:[`In ThingsBoard, open `,_jsx(_components.strong,{children:`Devices \u0026 assets → Devices → Industrial Motor 01`}),`. Select `,_jsx(_components.strong,{children:`Manage credentials → Access token → Copy access token`}),`, or use its `,_jsx(_components.strong,{children:`Copy access token`}),` shortcut.`]}),_jsx(Frame,{caption:`The motor device's credential controls.`,children:_jsx(OptimizedImage,{src:`https://mintcdn.com/code-and-compile/oJD_SnxirnRME6Em/images/tb-device-details.jpg?fit=max\u0026auto=format\u0026n=oJD_SnxirnRME6Em\u0026q=85\u0026s=da02ad8638bbc593e00ff43d830c070d`,alt:`Industrial Motor 01 device details and credential controls`,width:`563`,\"data-og-width\":`1280`,\"data-og-height\":`720`,\"data-path\":`images/tb-device-details.jpg`,\"data-optimize\":`true`,\"data-opv\":`3`,srcset:`https://mintcdn.com/code-and-compile/oJD_SnxirnRME6Em/images/tb-device-details.jpg?w=280\u0026fit=max\u0026auto=format\u0026n=oJD_SnxirnRME6Em\u0026q=85\u0026s=66db67c468687f7effab23ed5495c122 280w, https://mintcdn.com/code-and-compile/oJD_SnxirnRME6Em/images/tb-device-details.jpg?w=560\u0026fit=max\u0026auto=format\u0026n=oJD_SnxirnRME6Em\u0026q=85\u0026s=6dafafd8625d3789f9d4e67cbed8ec75 560w, https://mintcdn.com/code-and-compile/oJD_SnxirnRME6Em/images/tb-device-details.jpg?w=840\u0026fit=max\u0026auto=format\u0026n=oJD_SnxirnRME6Em\u0026q=85\u0026s=c6bcb7944383fdfdcae81aa6e2dff019 840w, https://mintcdn.com/code-and-compile/oJD_SnxirnRME6Em/images/tb-device-details.jpg?w=1100\u0026fit=max\u0026auto=format\u0026n=oJD_SnxirnRME6Em\u0026q=85\u0026s=165fe79bcb5ef12d8561c28cb886d1f6 1100w, https://mintcdn.com/code-and-compile/oJD_SnxirnRME6Em/images/tb-device-details.jpg?w=1650\u0026fit=max\u0026auto=format\u0026n=oJD_SnxirnRME6Em\u0026q=85\u0026s=af7a4f0f6def1ad2dcad0a3eff4d647f 1650w, https://mintcdn.com/code-and-compile/oJD_SnxirnRME6Em/images/tb-device-details.jpg?w=2500\u0026fit=max\u0026auto=format\u0026n=oJD_SnxirnRME6Em\u0026q=85\u0026s=47189c106d32f8351d1d7fea677c3f03 2500w`})}),_jsxs(_components.p,{children:[`New to device access tokens? The `,_jsx(_components.a,{href:`/product-reviews/smart-platforms/thingsboard/thingsboard-edge-setup#get-thingsboard-mqtt-connection-details`,children:`Edge Setup guide`}),` shows step by step where to find a device’s MQTT connection details.`]}),_jsxs(_components.p,{children:[`In Node-RED, double-click `,_jsx(_components.strong,{children:`Publish to ThingsBoard Cloud EU`}),` and edit its Server configuration. The download already has these connection settings; enter only your token under `,_jsx(_components.strong,{children:`Security → Username`}),`:`]}),_jsxs(Table,{children:[_jsx(_components.thead,{children:_jsxs(_components.tr,{children:[_jsx(_components.th,{children:`Setting`}),_jsx(_components.th,{children:`Value`})]})}),_jsxs(_components.tbody,{children:[_jsxs(_components.tr,{children:[_jsx(_components.td,{children:`Server`}),_jsx(_components.td,{children:_jsx(_components.code,{children:`mqtt.eu.thingsboard.cloud`})})]}),_jsxs(_components.tr,{children:[_jsx(_components.td,{children:`Port`}),_jsx(_components.td,{\"data-numeric\":`true`,children:_jsx(_components.code,{children:`8883`})})]}),_jsxs(_components.tr,{children:[_jsx(_components.td,{children:`TLS`}),_jsx(_components.td,{children:`Enabled, with server certificate verification`})]}),_jsxs(_components.tr,{children:[_jsx(_components.td,{children:`Security → Username`}),_jsx(_components.td,{children:_jsx(_components.strong,{children:`Your motor device access token`})})]}),_jsxs(_components.tr,{children:[_jsx(_components.td,{children:`Security → Password`}),_jsx(_components.td,{children:`Leave blank`})]}),_jsxs(_components.tr,{children:[_jsx(_components.td,{children:`Topic`}),_jsx(_components.td,{children:_jsx(_components.code,{children:`v1/devices/me/telemetry`})})]}),_jsxs(_components.tr,{children:[_jsx(_components.td,{children:`QoS / Retain`}),_jsxs(_components.td,{children:[_jsx(_components.code,{children:`1`}),` / `,_jsx(_components.code,{children:`false`})]})]})]})]}),_jsx(Frame,{caption:`MQTT uses port 8883 with TLS and certificate verification.`,children:_jsx(OptimizedImage,{src:`https://mintcdn.com/code-and-compile/oJD_SnxirnRME6Em/images/tb-mqtt-tls.jpg?fit=max\u0026auto=format\u0026n=oJD_SnxirnRME6Em\u0026q=85\u0026s=c15fc2a1e9307939cab4b4d128ca85c8`,alt:`Node-RED MQTT settings using port 8883, TLS and certificate verification`,width:`563`,\"data-og-width\":`1280`,\"data-og-height\":`720`,\"data-path\":`images/tb-mqtt-tls.jpg`,\"data-optimize\":`true`,\"data-opv\":`3`,srcset:`https://mintcdn.com/code-and-compile/oJD_SnxirnRME6Em/images/tb-mqtt-tls.jpg?w=280\u0026fit=max\u0026auto=format\u0026n=oJD_SnxirnRME6Em\u0026q=85\u0026s=6e242f12b4d259b4284b459f74baca3d 280w, https://mintcdn.com/code-and-compile/oJD_SnxirnRME6Em/images/tb-mqtt-tls.jpg?w=560\u0026fit=max\u0026auto=format\u0026n=oJD_SnxirnRME6Em\u0026q=85\u0026s=63abcd6d708420e4584776a95451a4c3 560w, https://mintcdn.com/code-and-compile/oJD_SnxirnRME6Em/images/tb-mqtt-tls.jpg?w=840\u0026fit=max\u0026auto=format\u0026n=oJD_SnxirnRME6Em\u0026q=85\u0026s=c07535d53729acb1a67b192ac1d9a5b1 840w, https://mintcdn.com/code-and-compile/oJD_SnxirnRME6Em/images/tb-mqtt-tls.jpg?w=1100\u0026fit=max\u0026auto=format\u0026n=oJD_SnxirnRME6Em\u0026q=85\u0026s=706165f99bd9676f8e685386bc8c2e0a 1100w, https://mintcdn.com/code-and-compile/oJD_SnxirnRME6Em/images/tb-mqtt-tls.jpg?w=1650\u0026fit=max\u0026auto=format\u0026n=oJD_SnxirnRME6Em\u0026q=85\u0026s=55dfa83fbe1b78662e7a22117174bd9e 1650w, https://mintcdn.com/code-and-compile/oJD_SnxirnRME6Em/images/tb-mqtt-tls.jpg?w=2500\u0026fit=max\u0026auto=format\u0026n=oJD_SnxirnRME6Em\u0026q=85\u0026s=5f8e5df7352c32bb4d0f5203e6988c1c 2500w`})}),_jsxs(_components.p,{children:[`Click `,_jsx(_components.strong,{children:`Update → Done → Deploy`}),`. The Inject node sends `,_jsx(_components.strong,{children:`every 5 seconds`}),`. Check that MQTT shows `,_jsx(_components.strong,{children:`connected`}),`.`]}),_jsxs(_components.p,{children:[`If it stays disconnected, recheck the hostname, token and internet connection. Use the token belonging to `,_jsx(_components.strong,{children:`Industrial Motor 01`}),`, not another device: that token determines which device receives the data.`]}),_jsx(Warning,{children:_jsx(_components.p,{children:`Keep your token private. Never disable certificate verification or include the token in shared project files.`})})]}),_jsxs(Step,{title:`Check the data in ThingsBoard`,children:[_jsxs(_components.ol,{children:[`\n`,_jsxs(_components.li,{children:[`Open `,_jsx(_components.strong,{children:`Devices \u0026 assets`}),` in ThingsBoard.`]}),`\n`,_jsxs(_components.li,{children:[`Click `,_jsx(_components.strong,{children:`Devices`}),`.`]}),`\n`,_jsxs(_components.li,{children:[`Open `,_jsx(_components.strong,{children:`Industrial Motor 01`}),`.`]}),`\n`,_jsxs(_components.li,{children:[`Click `,_jsx(_components.strong,{children:`Latest telemetry`}),`.`]}),`\n`,_jsxs(_components.li,{children:[`Find `,_jsx(_components.strong,{children:`speedRpm`}),`, the simulated motor speed.`]}),`\n`,_jsxs(_components.li,{children:[`Watch its value and `,_jsx(_components.strong,{children:`Last update time`}),` for at least 15 seconds. Timestamps should advance every 5 seconds.`]}),`\n`,_jsxs(_components.li,{children:[`Open `,_jsx(_components.strong,{children:`Dashboards`}),`.`]}),`\n`,_jsxs(_components.li,{children:[`Open `,_jsx(_components.strong,{children:`Motor RPM`}),` to see the gauge follow the speed.`]}),`\n`]}),_jsx(Frame,{caption:`Latest speedRpm and its update time.`,children:_jsx(OptimizedImage,{src:`https://mintcdn.com/code-and-compile/oJD_SnxirnRME6Em/images/tb-telemetry.jpg?fit=max\u0026auto=format\u0026n=oJD_SnxirnRME6Em\u0026q=85\u0026s=5c525c7f5c94efd243ba25efdb005832`,alt:`Industrial Motor 01 Latest telemetry showing speedRpm and update time`,width:`563`,\"data-og-width\":`1280`,\"data-og-height\":`720`,\"data-path\":`images/tb-telemetry.jpg`,\"data-optimize\":`true`,\"data-opv\":`3`,srcset:`https://mintcdn.com/code-and-compile/oJD_SnxirnRME6Em/images/tb-telemetry.jpg?w=280\u0026fit=max\u0026auto=format\u0026n=oJD_SnxirnRME6Em\u0026q=85\u0026s=f54e7ee72d0dec77ac38d108a5a5ec0a 280w, https://mintcdn.com/code-and-compile/oJD_SnxirnRME6Em/images/tb-telemetry.jpg?w=560\u0026fit=max\u0026auto=format\u0026n=oJD_SnxirnRME6Em\u0026q=85\u0026s=0b48332f32669b7b4fb4c55e0eb7c63f 560w, https://mintcdn.com/code-and-compile/oJD_SnxirnRME6Em/images/tb-telemetry.jpg?w=840\u0026fit=max\u0026auto=format\u0026n=oJD_SnxirnRME6Em\u0026q=85\u0026s=c74155ca098c673782d73cfdc787c231 840w, https://mintcdn.com/code-and-compile/oJD_SnxirnRME6Em/images/tb-telemetry.jpg?w=1100\u0026fit=max\u0026auto=format\u0026n=oJD_SnxirnRME6Em\u0026q=85\u0026s=94275374743ff6e6e5b2b8db6ae1a046 1100w, https://mintcdn.com/code-and-compile/oJD_SnxirnRME6Em/images/tb-telemetry.jpg?w=1650\u0026fit=max\u0026auto=format\u0026n=oJD_SnxirnRME6Em\u0026q=85\u0026s=63e5d85c81c65e7288fe4e75ffb45520 1650w, https://mintcdn.com/code-and-compile/oJD_SnxirnRME6Em/images/tb-telemetry.jpg?w=2500\u0026fit=max\u0026auto=format\u0026n=oJD_SnxirnRME6Em\u0026q=85\u0026s=ed714c8e62a5a94d6183f42adebdfb09 2500w`})}),_jsxs(_components.p,{children:[`Briefly pause the local publisher: timestamps should stop, then resume when you restart it. `,_jsx(_components.strong,{children:`0 RPM can simply mean that the simulated motor is stopped.`})]})]})]}),`\n`,_jsx(Frame,{caption:`The Motor RPM gauge follows the simulated speed.`,children:_jsx(OptimizedImage,{src:`https://mintcdn.com/code-and-compile/oJD_SnxirnRME6Em/images/tb-rpm.jpg?fit=max\u0026auto=format\u0026n=oJD_SnxirnRME6Em\u0026q=85\u0026s=896d262e4e6a1cf7419d1e33a2746fc1`,alt:`Motor RPM dashboard connected to the Node-RED simulation`,width:`563`,\"data-og-width\":`1280`,\"data-og-height\":`720`,\"data-path\":`images/tb-rpm.jpg`,\"data-optimize\":`true`,\"data-opv\":`3`,srcset:`https://mintcdn.com/code-and-compile/oJD_SnxirnRME6Em/images/tb-rpm.jpg?w=280\u0026fit=max\u0026auto=format\u0026n=oJD_SnxirnRME6Em\u0026q=85\u0026s=7fa6291f652fc1b38cfeb0d5d84be38f 280w, https://mintcdn.com/code-and-compile/oJD_SnxirnRME6Em/images/tb-rpm.jpg?w=560\u0026fit=max\u0026auto=format\u0026n=oJD_SnxirnRME6Em\u0026q=85\u0026s=367cea1bd82c909d3a3435f962e2c847 560w, https://mintcdn.com/code-and-compile/oJD_SnxirnRME6Em/images/tb-rpm.jpg?w=840\u0026fit=max\u0026auto=format\u0026n=oJD_SnxirnRME6Em\u0026q=85\u0026s=06a5504e5bd59d73e09e0112e0e37b2e 840w, https://mintcdn.com/code-and-compile/oJD_SnxirnRME6Em/images/tb-rpm.jpg?w=1100\u0026fit=max\u0026auto=format\u0026n=oJD_SnxirnRME6Em\u0026q=85\u0026s=f8a060f8f2262474a56fe46290c3c60a 1100w, https://mintcdn.com/code-and-compile/oJD_SnxirnRME6Em/images/tb-rpm.jpg?w=1650\u0026fit=max\u0026auto=format\u0026n=oJD_SnxirnRME6Em\u0026q=85\u0026s=5fdb262d7d90282fec283c66569ec223 1650w, https://mintcdn.com/code-and-compile/oJD_SnxirnRME6Em/images/tb-rpm.jpg?w=2500\u0026fit=max\u0026auto=format\u0026n=oJD_SnxirnRME6Em\u0026q=85\u0026s=844f9da882e4ed423dee0ffebf038875 2500w`})}),`\n`,_jsx(Heading,{level:`3`,id:`step-4-build-the-bigger-dashboard-with-ai`,children:`Step 4 – Build the bigger dashboard with AI`}),`\n`,_jsx(Info,{children:_jsx(_components.p,{children:`AI layouts can vary. Use the same telemetry keys and supported widgets; the arrangement need not match the images exactly.`})}),`\n`,_jsxs(_components.p,{children:[`Open `,_jsx(_components.strong,{children:`Motor RPM`}),` and click `,_jsx(_components.strong,{children:`Configure with AI`}),`. Keep the existing device and refine the installed dashboard; do not click Create Solution again.`]}),`\n`,_jsx(_components.p,{children:`Use built-in status cards, a ring or arc RPM gauge, charts and navigation. Keep the main screen focused on motor health; the Details view holds the secondary measurements.`}),`\n`,_jsx(Frame,{caption:`Configure with AI opens beside the dashboard.`,children:_jsx(OptimizedImage,{src:`https://mintcdn.com/code-and-compile/oJD_SnxirnRME6Em/images/tb-configure-ai.jpg?fit=max\u0026auto=format\u0026n=oJD_SnxirnRME6Em\u0026q=85\u0026s=eda9aa0d1caa4c2c91daa6a81e426257`,alt:`Configure with AI panel beside the motor dashboard`,width:`563`,\"data-og-width\":`1280`,\"data-og-height\":`720`,\"data-path\":`images/tb-configure-ai.jpg`,\"data-optimize\":`true`,\"data-opv\":`3`,srcset:`https://mintcdn.com/code-and-compile/oJD_SnxirnRME6Em/images/tb-configure-ai.jpg?w=280\u0026fit=max\u0026auto=format\u0026n=oJD_SnxirnRME6Em\u0026q=85\u0026s=93243f2cb7c72fcc68a57e192432eef9 280w, https://mintcdn.com/code-and-compile/oJD_SnxirnRME6Em/images/tb-configure-ai.jpg?w=560\u0026fit=max\u0026auto=format\u0026n=oJD_SnxirnRME6Em\u0026q=85\u0026s=d245665f207f85f23fa9c570f76f353a 560w, https://mintcdn.com/code-and-compile/oJD_SnxirnRME6Em/images/tb-configure-ai.jpg?w=840\u0026fit=max\u0026auto=format\u0026n=oJD_SnxirnRME6Em\u0026q=85\u0026s=721b9d46873e651d2652160b8dad27c0 840w, https://mintcdn.com/code-and-compile/oJD_SnxirnRME6Em/images/tb-configure-ai.jpg?w=1100\u0026fit=max\u0026auto=format\u0026n=oJD_SnxirnRME6Em\u0026q=85\u0026s=73639b90c7b0b8354e45e5e1da680c6e 1100w, https://mintcdn.com/code-and-compile/oJD_SnxirnRME6Em/images/tb-configure-ai.jpg?w=1650\u0026fit=max\u0026auto=format\u0026n=oJD_SnxirnRME6Em\u0026q=85\u0026s=734df074acfa4f738648435efbc63260 1650w, https://mintcdn.com/code-and-compile/oJD_SnxirnRME6Em/images/tb-configure-ai.jpg?w=2500\u0026fit=max\u0026auto=format\u0026n=oJD_SnxirnRME6Em\u0026q=85\u0026s=1fc1b8f34a0c5a482f43c219fc1b9e0d 2500w`})}),`\n`,_jsx(_components.p,{children:`Paste this prompt:`}),`\n`,_jsx(CodeBlock,{numberOfLines:`31`,language:`text`,children:_jsx(_components.pre,{className:`shiki shiki-themes github-light-default dark-plus`,style:{backgroundColor:`#ffffff`,\"--shiki-dark-bg\":`#0B0C0E`,color:`#1f2328`,\"--shiki-dark\":`#D4D4D4`},language:`text`,children:_jsxs(_components.code,{language:`text`,numberOfLines:`31`,children:[_jsx(_components.span,{className:`line`,children:_jsx(_components.span,{children:`Update this dashboard for the existing Industrial`})}),`\n`,_jsx(_components.span,{className:`line`,children:_jsx(_components.span,{children:`Motor 01. Rename it Motor Overview and keep the same`})}),`\n`,_jsx(_components.span,{className:`line`,children:_jsx(_components.span,{children:`device alias and live MQTT telemetry.`})}),`\n`,_jsx(_components.span,{className:`line`,children:_jsx(_components.span,{})}),`\n`,_jsx(_components.span,{className:`line`,children:_jsx(_components.span,{children:`Make a compact industrial panel using built-in widgets`})}),`\n`,_jsx(_components.span,{className:`line`,children:_jsx(_components.span,{children:`and their default card appearance:`})}),`\n`,_jsx(_components.span,{className:`line`,children:_jsx(_components.span,{children:`Top: four compact horizontal label-and-value cards`})}),`\n`,_jsx(_components.span,{className:`line`,children:_jsx(_components.span,{children:`for voltageV (V), currentA (A), powerW (W) and`})}),`\n`,_jsx(_components.span,{className:`line`,children:_jsx(_components.span,{children:`energyKWh (kWh). Avoid square cards with cramped text.`})}),`\n`,_jsx(_components.span,{className:`line`,children:_jsx(_components.span,{children:`Middle: standard status cards for Motor Status from`})}),`\n`,_jsx(_components.span,{className:`line`,children:_jsx(_components.span,{children:`motorOn and Motor Fault from fault on the left.`})}),`\n`,_jsx(_components.span,{className:`line`,children:_jsx(_components.span,{children:`In the centre, use a basic ring or arc gauge for the`})}),`\n`,_jsx(_components.span,{className:`line`,children:_jsx(_components.span,{children:`latest speedRpm, with a scale from 0 to 1600 RPM.`})}),`\n`,_jsx(_components.span,{className:`line`,children:_jsx(_components.span,{children:`On the right, add a wide orange vibrationRms chart.`})}),`\n`,_jsx(_components.span,{className:`line`,children:_jsx(_components.span,{children:`Use a real-time telemetry window of the last 1 minute`})}),`\n`,_jsx(_components.span,{className:`line`,children:_jsx(_components.span,{children:`with no aggregation, so a short demo shows raw values.`})}),`\n`,_jsx(_components.span,{className:`line`,children:_jsx(_components.span,{children:`Show minimum, maximum, average and latest vibration.`})}),`\n`,_jsx(_components.span,{className:`line`,children:_jsx(_components.span,{children:`Bottom: a compact device Alarms Table showing time,`})}),`\n`,_jsx(_components.span,{className:`line`,children:_jsx(_components.span,{children:`type, severity and status, including cleared history.`})}),`\n`,_jsx(_components.span,{className:`line`,children:_jsx(_components.span,{})}),`\n`,_jsx(_components.span,{className:`line`,children:_jsx(_components.span,{children:`Move temperature, humidity, availability, cycleCount,`})}),`\n`,_jsx(_components.span,{className:`line`,children:_jsx(_components.span,{children:`cycleTimeSec, goodParts, rejectRate, faultCode and`})}),`\n`,_jsx(_components.span,{className:`line`,children:_jsx(_components.span,{children:`alarmLevel, plus the speedRpm trend, into a Details`})}),`\n`,_jsx(_components.span,{className:`line`,children:_jsx(_components.span,{children:`state. Use compact horizontal value cards there too.`})}),`\n`,_jsx(_components.span,{className:`line`,children:_jsx(_components.span,{children:`Add small Details and Back navigation buttons.`})}),`\n`,_jsx(_components.span,{className:`line`,children:_jsx(_components.span,{})}),`\n`,_jsx(_components.span,{className:`line`,children:_jsx(_components.span,{children:`Keep it readable and uncluttered. Reuse built-in`})}),`\n`,_jsx(_components.span,{className:`line`,children:_jsx(_components.span,{children:`widgets. Do not create devices, emulators, motor`})}),`\n`,_jsx(_components.span,{className:`line`,children:_jsx(_components.span,{children:`controls, notifications or alarm rules in this step.`})}),`\n`,_jsx(_components.span,{className:`line`,children:_jsx(_components.span,{children:`Show the proposed changes for approval.`})}),`\n`,_jsx(_components.span,{className:`line`,children:_jsx(_components.span,{})})]})})}),`\n`,_jsxs(_components.p,{children:[`Review each proposal, `,_jsx(_components.strong,{children:`Approve`}),` the intended changes, and save. Check readability; request horizontal label-and-value cards if square cards make values too small.`]}),`\n`,_jsx(_components.p,{children:`Check the rendered dashboard, not just the text proposal. Its widgets must still point to the existing motor device, with readings updating from Node-RED.`}),`\n`,_jsxs(_components.p,{children:[`Read cycle time only while `,_jsx(_components.strong,{children:`motorOn=true`}),`: the simulator sends null for `,_jsx(_components.strong,{children:`cycleTimeSec`}),` while stopped, and a widget may retain its last non-null value.`]}),`\n`,_jsx(_components.p,{children:`To view your larger dashboard:`}),`\n`,_jsxs(_components.ol,{children:[`\n`,_jsxs(_components.li,{children:[`Open `,_jsx(_components.strong,{children:`Dashboards`}),`.`]}),`\n`,_jsxs(_components.li,{children:[`Open `,_jsx(_components.strong,{children:`Motor Overview`}),`.`]}),`\n`,_jsx(_components.li,{children:`Watch the electrical values, RPM gauge and vibration chart change as the simulation runs.`}),`\n`,_jsxs(_components.li,{children:[`Click `,_jsx(_components.strong,{children:`Details`}),` to see the secondary measurements.`]}),`\n`,_jsxs(_components.li,{children:[`Click `,_jsx(_components.strong,{children:`Back`}),` to return to the overview.`]}),`\n`]}),`\n`,_jsx(Frame,{children:_jsx(`video`,{controls:true,className:`mint-w-full mint-rounded-xl mint-mx-auto`,style:{aspectRatio:`1030 / 666`},src:`https://mintcdn.com/code-and-compile/oJD_SnxirnRME6Em/videos/motor-ai-dashboard.mp4?fit=max\u0026auto=format\u0026n=oJD_SnxirnRME6Em\u0026q=85\u0026s=52685e8514eb58e6201f544036dac4ab`,\"data-path\":`videos/motor-ai-dashboard.mp4`})}),`\n`,_jsx(_components.p,{children:_jsx(_components.em,{children:`Motor Overview showing simulated readings and cleared alarms.`})}),`\n`,_jsx(Heading,{level:`3`,id:`step-5-add-alarm-conditions-with-ai`,children:`Step 5 – Add alarm conditions with AI`}),`\n`,_jsxs(_components.p,{children:[`An `,_jsx(_components.strong,{children:`Alarms Table`}),` displays alarms; the rules below create them.`]}),`\n`,_jsxs(Steps,{children:[_jsxs(Step,{title:`Open the alarm assistant`,children:[_jsxs(_components.p,{children:[`Open `,_jsx(_components.strong,{children:`Alarms → Alarm rules → Configure with AI`}),`. Confirm that the assistant targets `,_jsx(_components.strong,{children:`Industrial Motor 01`}),` before approving any changes.`]}),_jsx(Frame,{caption:`The three motor alarm rules.`,children:_jsx(OptimizedImage,{src:`https://mintcdn.com/code-and-compile/oJD_SnxirnRME6Em/images/tb-alarm-rules.jpg?fit=max\u0026auto=format\u0026n=oJD_SnxirnRME6Em\u0026q=85\u0026s=a99c1b2d55e59b5b0fadd1534dba8803`,alt:`Motor Fault, High Vibration and High Temperature alarm rules`,width:`563`,\"data-og-width\":`1280`,\"data-og-height\":`720`,\"data-path\":`images/tb-alarm-rules.jpg`,\"data-optimize\":`true`,\"data-opv\":`3`,srcset:`https://mintcdn.com/code-and-compile/oJD_SnxirnRME6Em/images/tb-alarm-rules.jpg?w=280\u0026fit=max\u0026auto=format\u0026n=oJD_SnxirnRME6Em\u0026q=85\u0026s=eacf721457d8d8f39b6bf500ad50fdf4 280w, https://mintcdn.com/code-and-compile/oJD_SnxirnRME6Em/images/tb-alarm-rules.jpg?w=560\u0026fit=max\u0026auto=format\u0026n=oJD_SnxirnRME6Em\u0026q=85\u0026s=9ae1e65cdd0238de21723f67227dc767 560w, https://mintcdn.com/code-and-compile/oJD_SnxirnRME6Em/images/tb-alarm-rules.jpg?w=840\u0026fit=max\u0026auto=format\u0026n=oJD_SnxirnRME6Em\u0026q=85\u0026s=f69bffbb9dd1b2b9a5ee26bd298fa85c 840w, https://mintcdn.com/code-and-compile/oJD_SnxirnRME6Em/images/tb-alarm-rules.jpg?w=1100\u0026fit=max\u0026auto=format\u0026n=oJD_SnxirnRME6Em\u0026q=85\u0026s=ce8478e165653882811d45f53dfde7c7 1100w, https://mintcdn.com/code-and-compile/oJD_SnxirnRME6Em/images/tb-alarm-rules.jpg?w=1650\u0026fit=max\u0026auto=format\u0026n=oJD_SnxirnRME6Em\u0026q=85\u0026s=cfb1079e5160ef65a8a115fcb21d62eb 1650w, https://mintcdn.com/code-and-compile/oJD_SnxirnRME6Em/images/tb-alarm-rules.jpg?w=2500\u0026fit=max\u0026auto=format\u0026n=oJD_SnxirnRME6Em\u0026q=85\u0026s=c75929351dd9ea86aa58b8d96293882f 2500w`})})]}),_jsxs(Step,{title:`Give the alarm prompt`,children:[_jsx(CodeBlock,{numberOfLines:`18`,language:`text`,children:_jsx(_components.pre,{className:`shiki shiki-themes github-light-default dark-plus`,style:{backgroundColor:`#ffffff`,\"--shiki-dark-bg\":`#0B0C0E`,color:`#1f2328`,\"--shiki-dark\":`#D4D4D4`},language:`text`,children:_jsxs(_components.code,{language:`text`,numberOfLines:`18`,children:[_jsx(_components.span,{className:`line`,children:_jsx(_components.span,{children:`Create or update three alarm rules for the existing`})}),`\n`,_jsx(_components.span,{className:`line`,children:_jsx(_components.span,{children:`device Industrial Motor 01. Use latest telemetry,`})}),`\n`,_jsx(_components.span,{className:`line`,children:_jsx(_components.span,{children:`immediate conditions and an always-active schedule.`})}),`\n`,_jsx(_components.span,{className:`line`,children:_jsx(_components.span,{})}),`\n`,_jsx(_components.span,{className:`line`,children:_jsx(_components.span,{children:`Motor Fault: CRITICAL when fault=true.`})}),`\n`,_jsx(_components.span,{className:`line`,children:_jsx(_components.span,{children:`Clear when fault=false.`})}),`\n`,_jsx(_components.span,{className:`line`,children:_jsx(_components.span,{})}),`\n`,_jsx(_components.span,{className:`line`,children:_jsx(_components.span,{children:`High Vibration: WARNING when vibrationRms >7 and \u003c=9;`})}),`\n`,_jsx(_components.span,{className:`line`,children:_jsx(_components.span,{children:`CRITICAL when vibrationRms >9. Clear when \u003c=7 mm/s.`})}),`\n`,_jsx(_components.span,{className:`line`,children:_jsx(_components.span,{})}),`\n`,_jsx(_components.span,{className:`line`,children:_jsx(_components.span,{children:`High Temperature: WARNING when temperature >30 °C.`})}),`\n`,_jsx(_components.span,{className:`line`,children:_jsx(_components.span,{children:`Clear when temperature \u003c=30 °C.`})}),`\n`,_jsx(_components.span,{className:`line`,children:_jsx(_components.span,{})}),`\n`,_jsx(_components.span,{className:`line`,children:_jsx(_components.span,{children:`Treat missing data as unknown, not zero or false.`})}),`\n`,_jsx(_components.span,{className:`line`,children:_jsx(_components.span,{children:`Reuse matching rules; do not create duplicate devices`})}),`\n`,_jsx(_components.span,{className:`line`,children:_jsx(_components.span,{children:`or alarms. Show me the proposed changes for approval.`})}),`\n`,_jsx(_components.span,{className:`line`,children:_jsx(_components.span,{children:`Do not add email, SMS or other notification actions.`})}),`\n`,_jsx(_components.span,{className:`line`,children:_jsx(_components.span,{})})]})})}),_jsx(_components.p,{children:`Check the target device, severities, and clear conditions before approving:`}),_jsxs(Table,{children:[_jsx(_components.thead,{children:_jsxs(_components.tr,{children:[_jsx(_components.th,{children:`Alarm`}),_jsx(_components.th,{children:`Trigger`}),_jsx(_components.th,{children:`Clear`})]})}),_jsxs(_components.tbody,{children:[_jsxs(_components.tr,{children:[_jsx(_components.td,{children:`Motor Fault`}),_jsxs(_components.td,{children:[_jsx(_components.code,{children:`fault=true`}),` → CRITICAL`]}),_jsx(_components.td,{children:_jsx(_components.code,{children:`fault=false`})})]}),_jsxs(_components.tr,{children:[_jsx(_components.td,{children:`High Vibration`}),_jsxs(_components.td,{children:[_jsx(_components.code,{children:`>7`}),` and `,_jsx(_components.code,{children:`\u003c=9`}),` → WARNING; `,_jsx(_components.code,{children:`>9`}),` → CRITICAL`]}),_jsxs(_components.td,{children:[_jsx(_components.code,{children:`\u003c=7`}),` mm/s`]})]}),_jsxs(_components.tr,{children:[_jsx(_components.td,{children:`High Temperature`}),_jsxs(_components.td,{children:[_jsx(_components.code,{children:`>30`}),` °C → WARNING`]}),_jsxs(_components.td,{children:[_jsx(_components.code,{children:`\u003c=30`}),` °C`]})]})]})]}),_jsxs(_components.p,{children:[`Vibration uses `,_jsx(_components.strong,{children:`one alarm type`}),`; Critical takes priority above 9 mm/s. Check device/profile scope and reuse matching rules, avoiding duplicates. These are simulation thresholds, not real-motor operating limits.`]}),_jsx(Info,{children:_jsxs(_components.p,{children:[_jsx(_components.strong,{children:`Want to compare with hand-built alarm rules?`}),` `,_jsx(_components.a,{href:`/product-reviews/smart-platforms/thingsboard/real-time-vibration-monitoring-with-thingsboard-and-calculated-fields#step-5-configure-alarms`,children:`Step 5 of the Vibration Monitoring guide`}),` configures ISO 10816 alarm rules manually on a device profile, using real sensor data and calculated fields.`]})})]}),_jsxs(Step,{title:`Check the result`,children:[_jsxs(_components.p,{children:[`Return to `,_jsx(_components.strong,{children:`Motor Overview`}),`. Its Alarms Table must use the same device and show active and cleared alarms to reveal automatic clearing.`]}),_jsx(_components.p,{children:`The normal simulation may not cross every threshold during your check. Use the two controlled payloads below to demonstrate both alarm creation and clearing, then restore the repeating simulation.`}),_jsxs(_components.p,{children:[`Pause the repeating Inject and startup injection, then Deploy. Add a non-repeating Inject with a `,_jsx(_components.strong,{children:`JSON`}),` payload, connected directly to `,_jsx(_components.strong,{children:`Serialize telemetry as JSON`}),`. Send:`]}),_jsx(CodeBlock,{filename:``,numberOfLines:`1`,language:`json`,children:_jsx(_components.pre,{className:`shiki shiki-themes github-light-default dark-plus`,style:{backgroundColor:`#ffffff`,\"--shiki-dark-bg\":`#0B0C0E`,color:`#1f2328`,\"--shiki-dark\":`#D4D4D4`},language:`json`,children:_jsxs(_components.code,{language:`json`,numberOfLines:`1`,children:[_jsxs(_components.span,{className:`line`,children:[_jsx(_components.span,{style:{color:`#1F2328`,\"--shiki-dark\":`#D4D4D4`},children:`{`}),_jsx(_components.span,{style:{color:`#116329`,\"--shiki-dark\":`#9CDCFE`},children:`\"speedRpm\"`}),_jsx(_components.span,{style:{color:`#1F2328`,\"--shiki-dark\":`#D4D4D4`},children:`:`}),_jsx(_components.span,{style:{color:`#0550AE`,\"--shiki-dark\":`#B5CEA8`},children:`0`}),_jsx(_components.span,{style:{color:`#1F2328`,\"--shiki-dark\":`#D4D4D4`},children:`,`}),_jsx(_components.span,{style:{color:`#116329`,\"--shiki-dark\":`#9CDCFE`},children:`\"motorOn\"`}),_jsx(_components.span,{style:{color:`#1F2328`,\"--shiki-dark\":`#D4D4D4`},children:`:`}),_jsx(_components.span,{style:{color:`#0550AE`,\"--shiki-dark\":`#569CD6`},children:`false`}),_jsx(_components.span,{style:{color:`#1F2328`,\"--shiki-dark\":`#D4D4D4`},children:`,`}),_jsx(_components.span,{style:{color:`#116329`,\"--shiki-dark\":`#9CDCFE`},children:`\"temperature\"`}),_jsx(_components.span,{style:{color:`#1F2328`,\"--shiki-dark\":`#D4D4D4`},children:`:`}),_jsx(_components.span,{style:{color:`#0550AE`,\"--shiki-dark\":`#B5CEA8`},children:`31`}),_jsx(_components.span,{style:{color:`#1F2328`,\"--shiki-dark\":`#D4D4D4`},children:`,`}),_jsx(_components.span,{style:{color:`#116329`,\"--shiki-dark\":`#9CDCFE`},children:`\"vibrationRms\"`}),_jsx(_components.span,{style:{color:`#1F2328`,\"--shiki-dark\":`#D4D4D4`},children:`:`}),_jsx(_components.span,{style:{color:`#0550AE`,\"--shiki-dark\":`#B5CEA8`},children:`10`}),_jsx(_components.span,{style:{color:`#1F2328`,\"--shiki-dark\":`#D4D4D4`},children:`,`}),_jsx(_components.span,{style:{color:`#116329`,\"--shiki-dark\":`#9CDCFE`},children:`\"fault\"`}),_jsx(_components.span,{style:{color:`#1F2328`,\"--shiki-dark\":`#D4D4D4`},children:`:`}),_jsx(_components.span,{style:{color:`#0550AE`,\"--shiki-dark\":`#569CD6`},children:`true`}),_jsx(_components.span,{style:{color:`#1F2328`,\"--shiki-dark\":`#D4D4D4`},children:`,`}),_jsx(_components.span,{style:{color:`#116329`,\"--shiki-dark\":`#9CDCFE`},children:`\"faultCode\"`}),_jsx(_components.span,{style:{color:`#1F2328`,\"--shiki-dark\":`#D4D4D4`},children:`:`}),_jsx(_components.span,{style:{color:`#0550AE`,\"--shiki-dark\":`#B5CEA8`},children:`101`}),_jsx(_components.span,{style:{color:`#1F2328`,\"--shiki-dark\":`#D4D4D4`},children:`,`}),_jsx(_components.span,{style:{color:`#116329`,\"--shiki-dark\":`#9CDCFE`},children:`\"alarmLevel\"`}),_jsx(_components.span,{style:{color:`#1F2328`,\"--shiki-dark\":`#D4D4D4`},children:`:`}),_jsx(_components.span,{style:{color:`#0550AE`,\"--shiki-dark\":`#B5CEA8`},children:`2`}),_jsx(_components.span,{style:{color:`#1F2328`,\"--shiki-dark\":`#D4D4D4`},children:`}`})]}),`\n`]})})}),_jsxs(_components.p,{children:[`Expect Motor Fault and High Vibration to be `,_jsx(_components.strong,{children:`CRITICAL`}),`, and High Temperature to be `,_jsx(_components.strong,{children:`WARNING`}),`. Send the following normal values to clear them:`]}),_jsx(CodeBlock,{filename:``,numberOfLines:`1`,language:`json`,children:_jsx(_components.pre,{className:`shiki shiki-themes github-light-default dark-plus`,style:{backgroundColor:`#ffffff`,\"--shiki-dark-bg\":`#0B0C0E`,color:`#1f2328`,\"--shiki-dark\":`#D4D4D4`},language:`json`,children:_jsxs(_components.code,{language:`json`,numberOfLines:`1`,children:[_jsxs(_components.span,{className:`line`,children:[_jsx(_components.span,{style:{color:`#1F2328`,\"--shiki-dark\":`#D4D4D4`},children:`{`}),_jsx(_components.span,{style:{color:`#116329`,\"--shiki-dark\":`#9CDCFE`},children:`\"speedRpm\"`}),_jsx(_components.span,{style:{color:`#1F2328`,\"--shiki-dark\":`#D4D4D4`},children:`:`}),_jsx(_components.span,{style:{color:`#0550AE`,\"--shiki-dark\":`#B5CEA8`},children:`1100`}),_jsx(_components.span,{style:{color:`#1F2328`,\"--shiki-dark\":`#D4D4D4`},children:`,`}),_jsx(_components.span,{style:{color:`#116329`,\"--shiki-dark\":`#9CDCFE`},children:`\"motorOn\"`}),_jsx(_components.span,{style:{color:`#1F2328`,\"--shiki-dark\":`#D4D4D4`},children:`:`}),_jsx(_components.span,{style:{color:`#0550AE`,\"--shiki-dark\":`#569CD6`},children:`true`}),_jsx(_components.span,{style:{color:`#1F2328`,\"--shiki-dark\":`#D4D4D4`},children:`,`}),_jsx(_components.span,{style:{color:`#116329`,\"--shiki-dark\":`#9CDCFE`},children:`\"temperature\"`}),_jsx(_components.span,{style:{color:`#1F2328`,\"--shiki-dark\":`#D4D4D4`},children:`:`}),_jsx(_components.span,{style:{color:`#0550AE`,\"--shiki-dark\":`#B5CEA8`},children:`24`}),_jsx(_components.span,{style:{color:`#1F2328`,\"--shiki-dark\":`#D4D4D4`},children:`,`}),_jsx(_components.span,{style:{color:`#116329`,\"--shiki-dark\":`#9CDCFE`},children:`\"vibrationRms\"`}),_jsx(_components.span,{style:{color:`#1F2328`,\"--shiki-dark\":`#D4D4D4`},children:`:`}),_jsx(_components.span,{style:{color:`#0550AE`,\"--shiki-dark\":`#B5CEA8`},children:`2`}),_jsx(_components.span,{style:{color:`#1F2328`,\"--shiki-dark\":`#D4D4D4`},children:`,`}),_jsx(_components.span,{style:{color:`#116329`,\"--shiki-dark\":`#9CDCFE`},children:`\"fault\"`}),_jsx(_components.span,{style:{color:`#1F2328`,\"--shiki-dark\":`#D4D4D4`},children:`:`}),_jsx(_components.span,{style:{color:`#0550AE`,\"--shiki-dark\":`#569CD6`},children:`false`}),_jsx(_components.span,{style:{color:`#1F2328`,\"--shiki-dark\":`#D4D4D4`},children:`,`}),_jsx(_components.span,{style:{color:`#116329`,\"--shiki-dark\":`#9CDCFE`},children:`\"faultCode\"`}),_jsx(_components.span,{style:{color:`#1F2328`,\"--shiki-dark\":`#D4D4D4`},children:`:`}),_jsx(_components.span,{style:{color:`#0550AE`,\"--shiki-dark\":`#B5CEA8`},children:`0`}),_jsx(_components.span,{style:{color:`#1F2328`,\"--shiki-dark\":`#D4D4D4`},children:`,`}),_jsx(_components.span,{style:{color:`#116329`,\"--shiki-dark\":`#9CDCFE`},children:`\"alarmLevel\"`}),_jsx(_components.span,{style:{color:`#1F2328`,\"--shiki-dark\":`#D4D4D4`},children:`:`}),_jsx(_components.span,{style:{color:`#0550AE`,\"--shiki-dark\":`#B5CEA8`},children:`0`}),_jsx(_components.span,{style:{color:`#1F2328`,\"--shiki-dark\":`#D4D4D4`},children:`}`})]}),`\n`]})})}),_jsx(_components.p,{children:`Cleared alarms remain in history but disappear from an active-only table. Restore the five-second Inject and startup injection, then Deploy.`})]})]}),`\n`,_jsx(Heading,{level:`3`,id:`where-ai-still-needs-a-human`,children:`Where AI still needs a human`}),`\n`,_jsxs(_components.ul,{children:[`\n`,_jsxs(_components.li,{children:[_jsx(_components.strong,{children:`Unrequested resources:`}),` Review proposals and remove extras before approving.`]}),`\n`,_jsxs(_components.li,{children:[_jsx(_components.strong,{children:`Needle gauge:`}),` AI cannot select the analogue Speed gauge. Use the optional manual instructions below, or see the `,_jsx(_components.a,{href:`/product-reviews/smart-platforms/thingsboard/real-time-vibration-monitoring-with-thingsboard-and-calculated-fields#vibration-severity-gauge-iso-10816-bands`,children:`ISO-banded Speed gauge`}),` built by hand in the Vibration Monitoring guide.`]}),`\n`,_jsxs(_components.li,{children:[_jsx(_components.strong,{children:`Font size and scaling:`}),` These controls are not exposed in this AI workflow; use Edit mode when available.`]}),`\n`,_jsxs(_components.li,{children:[_jsx(_components.strong,{children:`Alarm history:`}),` AI cannot set a separate Alarms Table time window here. Select a longer global dashboard window for older alarms.`]}),`\n`,_jsxs(_components.li,{children:[_jsx(_components.strong,{children:`Rule scope:`}),` AI may attach rules to a device profile, affecting every device using it. Confirm the intended scope.`]}),`\n`]}),`\n`,_jsx(Heading,{level:`3`,id:`your-result-a-bigger-dashboard-using-ai-supported-widgets`,children:`Your result – a bigger dashboard using AI-supported widgets`}),`\n`,_jsx(_components.p,{children:`You now have electrical readings, motor status, speed, vibration, Details navigation and alarms that activate and clear. This completes the AI workflow.`}),`\n`,_jsx(Frame,{caption:`Motor Overview with electrical readings, status cards, RPM, vibration and alarm history.`,children:_jsx(OptimizedImage,{src:`https://mintcdn.com/code-and-compile/oJD_SnxirnRME6Em/images/tb-overview.jpg?fit=max\u0026auto=format\u0026n=oJD_SnxirnRME6Em\u0026q=85\u0026s=a9cf872943ef6d9135a1f537bc639d79`,alt:`AI-generated Motor Overview with RPM gauge, electrical readings, status cards, vibration chart and cleared alarms`,width:`563`,\"data-og-width\":`1280`,\"data-og-height\":`720`,\"data-path\":`images/tb-overview.jpg`,\"data-optimize\":`true`,\"data-opv\":`3`,srcset:`https://mintcdn.com/code-and-compile/oJD_SnxirnRME6Em/images/tb-overview.jpg?w=280\u0026fit=max\u0026auto=format\u0026n=oJD_SnxirnRME6Em\u0026q=85\u0026s=ce362d7a11480f725991386ecd13129f 280w, https://mintcdn.com/code-and-compile/oJD_SnxirnRME6Em/images/tb-overview.jpg?w=560\u0026fit=max\u0026auto=format\u0026n=oJD_SnxirnRME6Em\u0026q=85\u0026s=f32eab15a18fe178afdd7ac8f84be553 560w, https://mintcdn.com/code-and-compile/oJD_SnxirnRME6Em/images/tb-overview.jpg?w=840\u0026fit=max\u0026auto=format\u0026n=oJD_SnxirnRME6Em\u0026q=85\u0026s=9bc7af3f090130ab85a4c139e59ad42a 840w, https://mintcdn.com/code-and-compile/oJD_SnxirnRME6Em/images/tb-overview.jpg?w=1100\u0026fit=max\u0026auto=format\u0026n=oJD_SnxirnRME6Em\u0026q=85\u0026s=7a1efc715c44bfd48786c81a3f2f405a 1100w, https://mintcdn.com/code-and-compile/oJD_SnxirnRME6Em/images/tb-overview.jpg?w=1650\u0026fit=max\u0026auto=format\u0026n=oJD_SnxirnRME6Em\u0026q=85\u0026s=aee9259d419dd4383cc02a765a472833 1650w, https://mintcdn.com/code-and-compile/oJD_SnxirnRME6Em/images/tb-overview.jpg?w=2500\u0026fit=max\u0026auto=format\u0026n=oJD_SnxirnRME6Em\u0026q=85\u0026s=36fdc97f62ff7250d5f4e5287f8eda6e 2500w`})}),`\n`,_jsxs(Accordion,{title:`Optional manual editing`,id:`optional-manual-editing`,children:[_jsxs(_components.p,{children:[`Use `,_jsx(_components.strong,{children:`Edit mode`}),` for optional appearance changes, separate from the AI prompts and opening GIF. See `,_jsx(_components.a,{href:`/product-reviews/smart-platforms/thingsboard/thingsboard-edge-setup#step-5-create-dashboard`,children:`Edge Setup Step 5: Create Dashboard`}),` for widget basics.`]}),_jsxs(_components.p,{children:[`To add a needle gauge, open `,_jsx(_components.strong,{children:`Edit mode → Add widget → Analogue gauges → Speed gauge`}),`. Use the existing motor alias and `,_jsx(_components.code,{children:`speedRpm`}),`; set `,_jsx(_components.strong,{children:`RPM`}),`, `,_jsx(_components.strong,{children:`min 0`}),`, `,_jsx(_components.strong,{children:`max 1600`}),`, and `,_jsx(_components.strong,{children:`0 decimal digits`}),`, then enable the digital value. For the pictured style, use `,_jsx(_components.strong,{children:`Motor speed`}),` as the Units title, `,_jsx(_components.strong,{children:`#048AD3`}),` for Arrow and scale default color, and white for Plate color. Replace the old RPM widget and Save. See the `,_jsx(_components.a,{href:`https://thingsboard.io/docs/reference/widgets/analogue-gauges/speed-gauge/`,children:`Speed gauge guide`}),`.`]}),_jsx(Frame,{caption:`The optional needle gauge in the manual widget preview.`,children:_jsx(OptimizedImage,{src:`https://mintcdn.com/code-and-compile/oJD_SnxirnRME6Em/images/tb-manual-needle.jpg?fit=max\u0026auto=format\u0026n=oJD_SnxirnRME6Em\u0026q=85\u0026s=08d90404ddb2d1498c612fd4b97c0f0b`,alt:`Manual widget preview of the optional blue needle RPM gauge`,width:`563`,\"data-og-width\":`1280`,\"data-og-height\":`720`,\"data-path\":`images/tb-manual-needle.jpg`,\"data-optimize\":`true`,\"data-opv\":`3`,srcset:`https://mintcdn.com/code-and-compile/oJD_SnxirnRME6Em/images/tb-manual-needle.jpg?w=280\u0026fit=max\u0026auto=format\u0026n=oJD_SnxirnRME6Em\u0026q=85\u0026s=3854a71028731f4d02d03fe952d2b787 280w, https://mintcdn.com/code-and-compile/oJD_SnxirnRME6Em/images/tb-manual-needle.jpg?w=560\u0026fit=max\u0026auto=format\u0026n=oJD_SnxirnRME6Em\u0026q=85\u0026s=70a7305ca63d261b11134badcab89c64 560w, https://mintcdn.com/code-and-compile/oJD_SnxirnRME6Em/images/tb-manual-needle.jpg?w=840\u0026fit=max\u0026auto=format\u0026n=oJD_SnxirnRME6Em\u0026q=85\u0026s=4e89af2c61965e5eedf57614d528e841 840w, https://mintcdn.com/code-and-compile/oJD_SnxirnRME6Em/images/tb-manual-needle.jpg?w=1100\u0026fit=max\u0026auto=format\u0026n=oJD_SnxirnRME6Em\u0026q=85\u0026s=98d8fc2fc246aa75468214c9a7dc9f72 1100w, https://mintcdn.com/code-and-compile/oJD_SnxirnRME6Em/images/tb-manual-needle.jpg?w=1650\u0026fit=max\u0026auto=format\u0026n=oJD_SnxirnRME6Em\u0026q=85\u0026s=cc9ced28ec97a04875f3d4dfdae4422d 1650w, https://mintcdn.com/code-and-compile/oJD_SnxirnRME6Em/images/tb-manual-needle.jpg?w=2500\u0026fit=max\u0026auto=format\u0026n=oJD_SnxirnRME6Em\u0026q=85\u0026s=36a9117f1ebb01a3aaf248c99e540970 2500w`})})]}),`\n`,_jsx(_components.hr,{}),`\n`,_jsx(Heading,{level:`2`,id:`resources`,children:`Resources`}),`\n`,_jsx(Heading,{level:`4`,id:`node-red-motor-simulation-flow`,children:`Node-RED Motor Simulation Flow`}),`\n`,_jsx(_components.p,{children:`The complete flow: five-second Inject, motor simulator Function, JSON serialization, secure MQTT output and Debug. Add only your device access token after import.`}),`\n`,_jsx(Card,{title:`industrial-motor-cloud-flow.json`,icon:`download`,href:`https://raw.githubusercontent.com/Code-and-Compile/wiki-docs/main/wiki/.gitbook/assets/industrial-motor-cloud-flow.json`}),`\n`,_jsx(Heading,{level:`4`,id:`simulator-source-code-optional`,children:`Simulator Source Code (optional)`}),`\n`,_jsx(_components.p,{children:`The same Function code as plain text, for reading or building a flow manually. It is already included in the flow above; do not add it again.`}),`\n`,_jsx(Card,{title:`industrial-motor-simulator.txt`,icon:`download`,href:`https://raw.githubusercontent.com/Code-and-Compile/wiki-docs/main/wiki/.gitbook/assets/industrial-motor-simulator.txt`}),`\n`,_jsx(Heading,{level:`4`,id:`thingsboard-dashboard-and-alarm-rules`,children:`ThingsBoard Dashboard and Alarm Rules`}),`\n`,_jsx(_components.p,{children:`The Node-RED flow, the AI-generated Motor Overview dashboard export, all three alarm definitions and a README with import notes. No tokens or telemetry history are included.`}),`\n`,_jsx(Card,{title:`motor-ai-example-project.zip`,icon:`download`,href:`https://raw.githubusercontent.com/Code-and-Compile/wiki-docs/main/wiki/.gitbook/assets/motor-ai-example-project.zip`}),`\n`,_jsx(Info,{children:_jsxs(_components.p,{children:[`To learn how to import a dashboard and update its entity alias, refer to `,_jsx(_components.a,{href:`/product-reviews/smart-platforms/thingsboard/thingsboard-edge-setup`,children:`ThingsBoard (Edge Setup)`}),`. Alarm rules are not part of the dashboard export; recreate them in your account with Step 5.`]})}),`\n`,_jsx(Heading,{level:`4`,id:`further-reading`,children:`Further reading`}),`\n`,_jsxs(_components.ul,{children:[`\n`,_jsxs(_components.li,{children:[_jsx(_components.strong,{children:`Next step with real hardware:`}),` `,_jsx(_components.a,{href:`/product-reviews/smart-platforms/thingsboard/real-time-vibration-monitoring-with-thingsboard-and-calculated-fields`,children:`Real-Time Vibration Monitoring with ThingsBoard and Calculated Fields`}),` uses a physical Balluff sensor, a virtual PLC and ThingsBoard Calculated Fields.`]}),`\n`,_jsxs(_components.li,{children:[_jsx(_components.strong,{children:`Official ThingsBoard guides:`}),` `,_jsx(_components.a,{href:`https://thingsboard.io/docs/paas/eu/user-guide/ai-solution-creator/`,children:`AI Solution Creator`}),`, `,_jsx(_components.a,{href:`https://thingsboard.io/docs/paas/eu/user-guide/dashboards/#configure-dashboard-with-ai`,children:`dashboard AI`}),` and `,_jsx(_components.a,{href:`https://thingsboard.io/docs/paas/eu/user-guide/alarm-rules/#configure-alarm-rules-with-ai`,children:`alarm-rule AI`}),`.`]}),`\n`,_jsxs(_components.li,{children:[_jsx(_components.strong,{children:`Simulation limits:`}),` values and faults are synthetic, and in-memory counters reset when Node-RED restarts. `,_jsx(_components.code,{children:`availability`}),` indicates running time, not OEE.`]}),`\n`]}),`\n`,_jsx(Heading,{level:`2`,id:`work-with-me`,children:`Work With Me`}),`\n`,_jsxs(_components.p,{children:[`I regularly test `,_jsx(_components.strong,{children:`industrial automation and IIoT devices`}),`. If you’d like me to `,_jsx(_components.strong,{children:`review your product`}),` or showcase it in my courses and YouTube channel:`]}),`\n`,_jsxs(_components.p,{children:[`Email: `,_jsx(_components.a,{href:`mailto:rajvir@codeandcompile.com`,children:`rajvir@codeandcompile.com`}),` or drop me a message on `,_jsx(_components.a,{href:`https://www.linkedin.com/in/singhrajvir/`,children:`LinkedIn`})]})]})}function MDXContent(props={}){const{wrapper:MDXLayout}={..._provideComponents(),...props.components};return MDXLayout?_jsx(MDXLayout,{...props,children:_jsx(_createMdxContent,{...props})}):_createMdxContent(props)}return{default:MDXContent};function _missingMdxReference(id,component){throw new Error(`Expected `+(component?`component`:`object`)+\" `\"+id+\"` to be defined: you likely forgot to import, pass, or provide it.\")}","frontmatter":{},"scope":{"config":{},"pageMetadata":{"title":"From Prompt to Live Dashboard with ThingsBoard AI","description":"Build a live motor dashboard with ThingsBoard AI in about 90 minutes: one prompt for an RPM gauge, a Node-RED simulation over secure MQTT, an AI-expanded overview and AI-created alarm rules.","hidden":true,"href":"/product-reviews/smart-platforms/thingsboard/from-prompt-to-live-dashboard-with-thingsboard-ai","hiddenSetByFrontmatter":true}}},"mdxSourceWithNoJs":null},"mdxExtracts":{"tableOfContents":[{"title":"Five steps, from your first prompt to alarms","slug":"five-steps-from-your-first-prompt-to-alarms","depth":3,"children":[]},{"title":"Before you start","slug":"before-you-start","depth":3,"children":[]},{"title":"Hardware \u0026 Software Used","slug":"hardware-software-used","depth":3,"children":[]},{"title":"Step 1 – Create your Cloud account","slug":"step-1-create-your-cloud-account","depth":3,"children":[]},{"title":"Step 2 – Create a simple RPM dashboard","slug":"step-2-create-a-simple-rpm-dashboard","depth":3,"children":[]},{"title":"Step 3 – Connect the example Node-RED simulation","slug":"step-3-connect-the-example-node-red-simulation","depth":3,"children":[]},{"title":"Step 4 – Build the bigger dashboard with AI","slug":"step-4-build-the-bigger-dashboard-with-ai","depth":3,"children":[]},{"title":"Step 5 – Add alarm conditions with AI","slug":"step-5-add-alarm-conditions-with-ai","depth":3,"children":[]},{"title":"Where AI still needs a human","slug":"where-ai-still-needs-a-human","depth":3,"children":[]},{"title":"Your result – a bigger dashboard using AI-supported widgets","slug":"your-result-a-bigger-dashboard-using-ai-supported-widgets","depth":3,"children":[]},{"title":"Resources","slug":"resources","depth":2,"children":[{"title":"Node-RED Motor Simulation Flow","slug":"node-red-motor-simulation-flow","depth":4,"children":[]},{"title":"Simulator Source Code (optional)","slug":"simulator-source-code-optional","depth":4,"children":[]},{"title":"ThingsBoard Dashboard and Alarm Rules","slug":"thingsboard-dashboard-and-alarm-rules","depth":4,"children":[]},{"title":"Further reading","slug":"further-reading","depth":4,"children":[]}]},{"title":"Work With Me","slug":"work-with-me","depth":2,"children":[]}],"codeExamples":{}},"jsLinks":["/_mintlify/custom/code-and-compile/2ff53bdbfac34a49/consent.js"],"dynamicCss":".mint-mx-auto {\n margin-left: auto;\n margin-right: auto\n}\n.mint-w-full {\n width: 100%\n}\n.mint-rounded-xl {\n border-radius: 0.75rem\n}","narration":{"path":"product-reviews/smart-platforms/thingsboard/from-prompt-to-live-dashboard-with-thingsboard-ai","locale":"en","estimatedDurationSec":778},"subdomain":"code-and-compile","siteName":"Code and Compile Wiki","title":"From Prompt to Live Dashboard with ThingsBoard AI - Code and Compile Wiki","relatedPagesConfig":{"enabled":true,"limit":5,"mode":"automatic"},"navMaps":{"firstHrefInVersion":{},"firstHrefInLanguage":{}},"lastModified":"2026-11-10T17:15:09.386Z","originalFileLocation":"product-reviews/smart-platforms/thingsboard/from-prompt-to-live-dashboard-with-thingsboard-ai.mdx"},"headHtml":"\u003cscript data-mint-head>(function(){var d=document.documentElement,p=null;if(!p){try{p=localStorage.getItem(\"isDarkMode\")}catch(e){}if(p==='true')p='dark';else if(p==='false')p='light';if(p!=='light'\u0026\u0026p!=='dark'\u0026\u0026p!=='system')p=\"system\"}var r=p==='system'?(matchMedia(\"(prefers-color-scheme: dark)\").matches?'dark':'light'):p;d.classList.remove(r==='dark'?'light':'dark');d.classList.add(r);d.setAttribute(\"data-theme-preference\",p)})();\u003c/script>\u003cmeta data-mint-head name=\"description\" content=\"Build a live motor dashboard with ThingsBoard AI in about 90 minutes: one prompt for an RPM gauge, a Node-RED simulation over secure MQTT, an AI-expanded overview and AI-created alarm rules.\">\u003cmeta data-mint-head name=\"application-name\" content=\"Code and Compile Wiki\">\u003cmeta data-mint-head name=\"generator\" content=\"Mintlify\">\u003clink data-mint-head rel=\"icon\" type=\"image/png\" sizes=\"192x192\" href=\"/mintlify-assets/_mintlify/favicons/code-and-compile/J4bDdR7f6_fJIDVF/_generated/favicon/android-chrome-192x192.png\" media=\"(prefers-color-scheme: light)\">\u003clink data-mint-head rel=\"apple-touch-icon\" type=\"image/png\" sizes=\"180x180\" href=\"/mintlify-assets/_mintlify/favicons/code-and-compile/J4bDdR7f6_fJIDVF/_generated/favicon/apple-touch-icon.png\">\u003clink data-mint-head rel=\"icon\" type=\"image/png\" sizes=\"16x16\" href=\"/mintlify-assets/_mintlify/favicons/code-and-compile/J4bDdR7f6_fJIDVF/_generated/favicon/favicon-16x16.png\" media=\"(prefers-color-scheme: light)\">\u003clink data-mint-head rel=\"icon\" type=\"image/png\" sizes=\"32x32\" href=\"/mintlify-assets/_mintlify/favicons/code-and-compile/J4bDdR7f6_fJIDVF/_generated/favicon/favicon-32x32.png\" media=\"(prefers-color-scheme: light)\">\u003clink data-mint-head rel=\"shortcut icon\" type=\"image/x-icon\" href=\"/mintlify-assets/_mintlify/favicons/code-and-compile/J4bDdR7f6_fJIDVF/_generated/favicon/favicon.ico\" media=\"(prefers-color-scheme: light)\">\u003clink data-mint-head rel=\"icon\" type=\"image/png\" sizes=\"192x192\" href=\"/mintlify-assets/_mintlify/favicons/code-and-compile/J4bDdR7f6_fJIDVF/_generated/favicon-dark/android-chrome-192x192.png\" media=\"(prefers-color-scheme: dark)\">\u003clink data-mint-head rel=\"icon\" type=\"image/png\" sizes=\"16x16\" href=\"/mintlify-assets/_mintlify/favicons/code-and-compile/J4bDdR7f6_fJIDVF/_generated/favicon-dark/favicon-16x16.png\" media=\"(prefers-color-scheme: dark)\">\u003clink data-mint-head rel=\"icon\" type=\"image/png\" sizes=\"32x32\" href=\"/mintlify-assets/_mintlify/favicons/code-and-compile/J4bDdR7f6_fJIDVF/_generated/favicon-dark/favicon-32x32.png\" media=\"(prefers-color-scheme: dark)\">\u003clink data-mint-head rel=\"shortcut icon\" type=\"image/x-icon\" href=\"/mintlify-assets/_mintlify/favicons/code-and-compile/J4bDdR7f6_fJIDVF/_generated/favicon-dark/favicon.ico\" media=\"(prefers-color-scheme: dark)\">\u003cmeta data-mint-head property=\"og:title\" content=\"From Prompt to Live Dashboard with ThingsBoard AI - Code and Compile Wiki\">\u003cmeta data-mint-head property=\"og:description\" content=\"Build a live motor dashboard with ThingsBoard AI in about 90 minutes: one prompt for an RPM gauge, a Node-RED simulation over secure MQTT, an AI-expanded overview and AI-created alarm rules.\">\u003cmeta data-mint-head property=\"og:site_name\" content=\"Code and Compile Wiki\">\u003cmeta data-mint-head property=\"og:url\" content=\"https://wiki.codeandcompile.com/product-reviews/smart-platforms/thingsboard/from-prompt-to-live-dashboard-with-thingsboard-ai\">\u003cmeta data-mint-head property=\"og:type\" content=\"website\">\u003cmeta data-mint-head property=\"og:image\" content=\"https://code-and-compile.mintlify.site/_mintlify/api/og/v2?division=Product+reviews\u0026amp;title=From+Prompt+to+Live+Dashboard+with+ThingsBoard+AI\u0026amp;description=Build+a+live+motor+dashboard+with+ThingsBoard+AI+in+about+90+minutes%3A+one+prompt+for+an+RPM+gauge%2C+a+Node-RED+simulation+over+secure+MQTT%2C+an+AI-expanded+overvi\u0026amp;theme=09d63dc055ece8e10236b756\u0026amp;signature=bb8fa4bce9d8f69b63d50359794df07245d1e580711e103fc44b4cb3a1cd28c1\">\u003cmeta data-mint-head property=\"og:image:width\" content=\"1200\">\u003cmeta data-mint-head property=\"og:image:height\" content=\"630\">\u003cmeta data-mint-head name=\"twitter:card\" content=\"summary_large_image\">\u003cmeta data-mint-head name=\"twitter:title\" content=\"From Prompt to Live Dashboard with ThingsBoard AI - Code and Compile Wiki\">\u003cmeta data-mint-head name=\"twitter:description\" content=\"Build a live motor dashboard with ThingsBoard AI in about 90 minutes: one prompt for an RPM gauge, a Node-RED simulation over secure MQTT, an AI-expanded overview and AI-created alarm rules.\">\u003cmeta data-mint-head name=\"twitter:image\" content=\"https://code-and-compile.mintlify.site/_mintlify/api/og/v2?division=Product+reviews\u0026amp;title=From+Prompt+to+Live+Dashboard+with+ThingsBoard+AI\u0026amp;description=Build+a+live+motor+dashboard+with+ThingsBoard+AI+in+about+90+minutes%3A+one+prompt+for+an+RPM+gauge%2C+a+Node-RED+simulation+over+secure+MQTT%2C+an+AI-expanded+overvi\u0026amp;theme=09d63dc055ece8e10236b756\u0026amp;signature=bb8fa4bce9d8f69b63d50359794df07245d1e580711e103fc44b4cb3a1cd28c1\">\u003cmeta data-mint-head name=\"twitter:image:width\" content=\"1200\">\u003cmeta data-mint-head name=\"twitter:image:height\" content=\"630\">\u003cmeta data-mint-head name=\"msapplication-config\" content=\"/mintlify-assets/_mintlify/favicons/code-and-compile/J4bDdR7f6_fJIDVF/_generated/favicon/browserconfig.xml\">\u003cmeta data-mint-head name=\"apple-mobile-web-app-title\" content=\"Code and Compile Wiki\">\u003cmeta data-mint-head name=\"msapplication-TileColor\" content=\"#F78F3F\">\u003clink data-mint-head rel=\"canonical\" href=\"https://wiki.codeandcompile.com/product-reviews/smart-platforms/thingsboard/from-prompt-to-live-dashboard-with-thingsboard-ai\">\u003clink data-mint-head rel=\"alternate\" type=\"application/xml\" href=\"/sitemap.xml\">\u003clink data-mint-head rel=\"alternate\" type=\"text/markdown\" href=\"/product-reviews/smart-platforms/thingsboard/from-prompt-to-live-dashboard-with-thingsboard-ai.md\">\u003cscript data-mint-head type=\"application/ld+json\">{\"@context\":\"https://schema.org\",\"@graph\":[{\"@type\":\"Organization\",\"@id\":\"https://wiki.codeandcompile.com/#organization\",\"name\":\"Code and Compile Wiki\",\"url\":\"https://wiki.codeandcompile.com\"},{\"@type\":\"WebSite\",\"@id\":\"https://wiki.codeandcompile.com#website\",\"name\":\"Code and Compile Wiki\",\"url\":\"https://wiki.codeandcompile.com\",\"publisher\":{\"@id\":\"https://wiki.codeandcompile.com/#organization\"}},{\"@type\":\"WebPage\",\"@id\":\"https://wiki.codeandcompile.com/product-reviews/smart-platforms/thingsboard/from-prompt-to-live-dashboard-with-thingsboard-ai#webpage\",\"url\":\"https://wiki.codeandcompile.com/product-reviews/smart-platforms/thingsboard/from-prompt-to-live-dashboard-with-thingsboard-ai\",\"name\":\"From Prompt to Live Dashboard with ThingsBoard AI\",\"description\":\"Build a live motor dashboard with ThingsBoard AI in about 90 minutes: one prompt for an RPM gauge, a Node-RED simulation over secure MQTT, an AI-expanded overview and AI-created alarm rules.\",\"dateModified\":\"2026-11-10T17:15:09.386Z\",\"isPartOf\":{\"@id\":\"https://wiki.codeandcompile.com#website\"},\"breadcrumb\":{\"@id\":\"https://wiki.codeandcompile.com/product-reviews/smart-platforms/thingsboard/from-prompt-to-live-dashboard-with-thingsboard-ai#breadcrumb\"}},{\"@type\":\"BreadcrumbList\",\"@id\":\"https://wiki.codeandcompile.com/product-reviews/smart-platforms/thingsboard/from-prompt-to-live-dashboard-with-thingsboard-ai#breadcrumb\",\"itemListElement\":[{\"@type\":\"ListItem\",\"position\":1,\"name\":\"IoT platforms and alerts\",\"item\":\"https://wiki.codeandcompile.com/product-reviews/smart-platforms/thingsboard/thingsboard-edge-setup\"},{\"@type\":\"ListItem\",\"position\":2,\"name\":\"ThingsBoard\",\"item\":\"https://wiki.codeandcompile.com/product-reviews/smart-platforms/thingsboard\"},{\"@type\":\"ListItem\",\"position\":3,\"name\":\"From Prompt to Live Dashboard with ThingsBoard AI\",\"item\":\"https://wiki.codeandcompile.com/product-reviews/smart-platforms/thingsboard/from-prompt-to-live-dashboard-with-thingsboard-ai\"}]},{\"@type\":[\"Article\",\"TechArticle\"],\"@id\":\"https://wiki.codeandcompile.com/product-reviews/smart-platforms/thingsboard/from-prompt-to-live-dashboard-with-thingsboard-ai#article\",\"headline\":\"From Prompt to Live Dashboard with ThingsBoard AI\",\"name\":\"From Prompt to Live Dashboard with ThingsBoard AI\",\"description\":\"Build a live motor dashboard with ThingsBoard AI in about 90 minutes: one prompt for an RPM gauge, a Node-RED simulation over secure MQTT, an AI-expanded overview and AI-created alarm rules.\",\"url\":\"https://wiki.codeandcompile.com/product-reviews/smart-platforms/thingsboard/from-prompt-to-live-dashboard-with-thingsboard-ai\",\"mainEntityOfPage\":{\"@id\":\"https://wiki.codeandcompile.com/product-reviews/smart-platforms/thingsboard/from-prompt-to-live-dashboard-with-thingsboard-ai#webpage\"},\"dateModified\":\"2026-11-10T17:15:09.386Z\",\"publisher\":{\"@id\":\"https://wiki.codeandcompile.com/#organization\"},\"isPartOf\":{\"@id\":\"https://wiki.codeandcompile.com#website\"}}]}\u003c/script>\u003cscript data-mint-head type=\"application/ld+json\">{\"@context\":\"https://schema.org\",\"@type\":\"WebSite\",\"name\":\"Code and Compile Wiki\",\"publisher\":{\"@type\":\"Organization\",\"name\":\"Code and Compile Wiki\"},\"provider\":{\"@type\":\"Organization\",\"name\":\"Mintlify\",\"url\":\"https://mintlify.com\"}}\u003c/script>","agentPointerHref":"/product-reviews/smart-platforms/thingsboard/from-prompt-to-live-dashboard-with-thingsboard-ai.md","siteName":"Code and Compile Wiki","nav":{"global":null,"tabs":[{"tab":"Course resources","icon":"graduation-cap","pages":[{"title":"Course resources","href":""}]},{"tab":"Product reviews","icon":"circle-play","menu":[{"item":"Smart devices","icon":"microchip","description":"Hands-on reviews of industrial hardware","pages":[{"title":"Smart devices","href":"/product-reviews/smart-devices"}]},{"item":"Smart platforms","icon":"cloud","description":"Virtual PLCs, MQTT, IoT platforms and alerts","groups":[{"group":"Smart platforms","icon":"cloud","pages":[{"title":"Smart Platforms","sidebarTitle":"Overview","icon":"grid-2","href":"/product-reviews/smart-platforms"}]},{"group":"Virtual PLCs","pages":[{"title":"Virtual PLCs","sidebarTitle":"Overview","href":"/product-reviews/smart-platforms/virtual-plcs/index"},{"group":"Autonomy Edge- OpenPLC redefined","root":{"title":"Autonomy Edge- OpenPLC redefined","icon":"transmission","href":"/product-reviews/smart-platforms/virtual-plcs/autonomy-edge-openplc-redefined/index"},"pages":[{"title":"OpenPLC Walkthrough","icon":"cloud","href":"/product-reviews/smart-platforms/virtual-plcs/autonomy-edge-openplc-redefined/openplc-walkthrough"},{"title":"OpenPLC interfacing with IO-Link Master","icon":"square-binary","href":"/product-reviews/smart-platforms/virtual-plcs/autonomy-edge-openplc-redefined/openplc-interfacing-with-io-link-master"},{"title":"OpenPLC with Python FB","icon":"python","href":"/product-reviews/smart-platforms/virtual-plcs/autonomy-edge-openplc-redefined/openplc-with-python-fb"}]},{"group":"OTee- Open Architecture Real time Virtual PLCs","root":{"title":"OTee- Open Architecture Real time Virtual PLCs","icon":"desktop","href":"/product-reviews/smart-platforms/virtual-plcs/otee-open-architecture-real-time-virtual-plcs/index"},"pages":[{"title":"OTee Docker Commands","icon":"docker","href":"/product-reviews/smart-platforms/virtual-plcs/otee-open-architecture-real-time-virtual-plcs/otee-docker-commands"}]}]},{"group":"MQTT and edge data","pages":[{"group":"HiveMQ","root":{"title":"HiveMQ","href":"/product-reviews/smart-platforms/hivemq/index"},"pages":[{"title":"PLC to Cloud via HiveMQ (Edge + Cloud) — OPC UA → MQTT → Confluent","icon":"cloud","href":"/product-reviews/smart-platforms/hivemq/plc-to-cloud-via-hivemq-edge-+-cloud-opc-ua-mqtt-confluent"},{"title":"Multi-Site PLC-to-Cloud Flow using HiveMQ Edge + Cloud","icon":"cloud","href":"/product-reviews/smart-platforms/hivemq/multi-site-plc-to-cloud-flow-using-hivemq-edge-+-cloud"},{"group":"HiveMQ Edge-to-Cloud AI Pipeline","root":{"title":"HiveMQ Edge-to-Cloud AI Pipeline","icon":"head-side-gear","href":"/product-reviews/smart-platforms/hivemq/hivemq-edge-to-cloud-ai-pipeline/index"},"pages":[{"title":"Anomaly detection Code Explanation","href":"/product-reviews/smart-platforms/hivemq/hivemq-edge-to-cloud-ai-pipeline/anomaly-detection-code-explanation"}]},{"title":"Secure OT/IT Data Integration Using HiveMQ Edge and Site DMZ","icon":"shield","href":"/product-reviews/smart-platforms/hivemq/secure-ot-it-data-integration-using-hivemq-edge-and-site-dmz"}]},{"group":"Coreflux","root":{"title":"Coreflux","href":"/product-reviews/smart-platforms/coreflux/index"},"pages":[{"title":"Coreflux MQTT Broker","icon":"chart-network","href":"/product-reviews/smart-platforms/coreflux/coreflux-mqtt-broker"}]},{"title":"thin-edge.io","href":"/product-reviews/smart-platforms/thin-edge.io"}]},{"group":"IoT platforms and alerts","pages":[{"group":"ThingsBoard","root":{"title":"ThingsBoard","href":"/product-reviews/smart-platforms/thingsboard/index"},"pages":[{"title":"ThingsBoard (Edge Setup)","icon":"cloud","href":"/product-reviews/smart-platforms/thingsboard/thingsboard-edge-setup"},{"title":"Real-Time Vibration Monitoring with ThingsBoard and Calculated Fields","icon":"satellite-dish","href":"/product-reviews/smart-platforms/thingsboard/real-time-vibration-monitoring-with-thingsboard-and-calculated-fields"},{"group":"HiveMQ Edge-to-Cloud AI Pipeline","root":{"title":"HiveMQ Edge-to-Cloud AI Pipeline","icon":"head-side-gear","hidden":true,"href":"/product-reviews/smart-platforms/thingsboard/hivemq-edge-to-cloud-ai-pipeline/index"},"pages":[{"title":"Anomaly detection Code Explanation","description":"Overview of the Anomaly Detection API (Flask + PyOD)","href":"/product-reviews/smart-platforms/thingsboard/hivemq-edge-to-cloud-ai-pipeline/anomaly-detection-code-explanation"}]},{"title":"Secure OT/IT Data Integration Using HiveMQ Edge and Site DMZ","description":"Typical enterprise OT/IT integration using HiveMQ Edge and Site DMZ","icon":"shield","hidden":true,"href":"/product-reviews/smart-platforms/thingsboard/secure-ot-it-data-integration-using-hivemq-edge-and-site-dmz"},{"title":"From Prompt to Live Dashboard with ThingsBoard AI","hidden":true,"href":"/product-reviews/smart-platforms/thingsboard/from-prompt-to-live-dashboard-with-thingsboard-ai"}]},{"group":"WAGO","root":{"title":"WAGO","description":"Guides for WAGO controllers: predictive maintenance and remote app deployment.","href":"/product-reviews/smart-platforms/wago/index"},"pages":[{"title":"Predictive Maintenance and Data Analytics","icon":"chart-column","href":"/product-reviews/smart-platforms/wago/predictive-maintenance-and-data-analytics"},{"title":"Remote App Deployment","icon":"mobile-screen","href":"/product-reviews/smart-platforms/wago/remote-app-deployment"}]},{"title":"OEE made Easy with FlowFuse","icon":"chart-pie-simple-circle-currency","href":"/product-reviews/smart-platforms/oee-made-easy-with-flowfuse"},{"title":"SIGNL4- Get your PLC alerts on the mobile app","icon":"mobile-signal","href":"/product-reviews/smart-platforms/signl4-get-your-plc-alerts-on-the-mobile-app"},{"title":"Vibration sensor data on Augmented Reality","icon":"mobile-retro","href":"/product-reviews/smart-platforms/vibration-sensor-data-on-augmented-reality"}]}]}]},{"tab":"Free tools","icon":"calculator","pages":[{"title":"Free tools","href":"/tools"}]},{"tab":"About","icon":"user","pages":[{"title":"About","href":"/who-am-i/meet-the-creator"}]}]},"basePath":"","title":"From Prompt to Live Dashboard with ThingsBoard AI - Code and Compile Wiki","buildId":"dpl_596ePT575z4qnAFksq1biRW97aLY","deploymentId":"dpl_596ePT575z4qnAFksq1biRW97aLY","dynamics":["10e4515597","2bfc744e19","07c022d89b","a74be98ba7"],"chunks":["BannerMarkdown-6DXXLlfN.js","dist-CmKHfscc.js","lib-DuNMoZ05.js","lib-B8HbPgcC.js","clsx-C3kuh_dz.js","html-void-elements-mCSPHezU.js","katex-YMM-FMeD.js","marked.esm-CZWythHk.js","NarrationPlayer-B8rALa9K.js","types-CiTgMxws.js","shallow-BG4cT0fH.js","Frame-BXrZabKK.js","DynamicMarkdown-CtasenyM.js","zoom-image-lightbox-C5F0mVLH.js","lightbox-handle-r17bVUz3.js"]}